CPU vs GPU
Every number on this page comes from one run of benchmarks/run_benchmarks.sh on a single machine:
| CPU | AMD Ryzen 9 3950X 16-Core Processor (32 logical cores, torch using 16 threads) |
| GPU 0 | NVIDIA GeForce RTX 3090 |
| GPU 1 | NVIDIA GeForce RTX 3080 |
| PyTorch | 2.10.0+cu128 / CUDA 12.8 |
| torchtsetlin | 0.6.0 |
| Python | 3.10.11 |
| measured | 2026-10-29 09:10:06 |
How to read these
Each point is the median of three timed blocks of steady-state calls, after a warm-up, with the device synchronised once per block. The micro-benchmarks use synthetic Boolean data at 20 % density, resident on the device unless stated otherwise. Reproduce — or replace these numbers with your own hardware's — with:
These are the numbers of torchtsetlin 0.6.0. Benchmark history puts the same suites side by side for every earlier version.
Throughput vs batch size
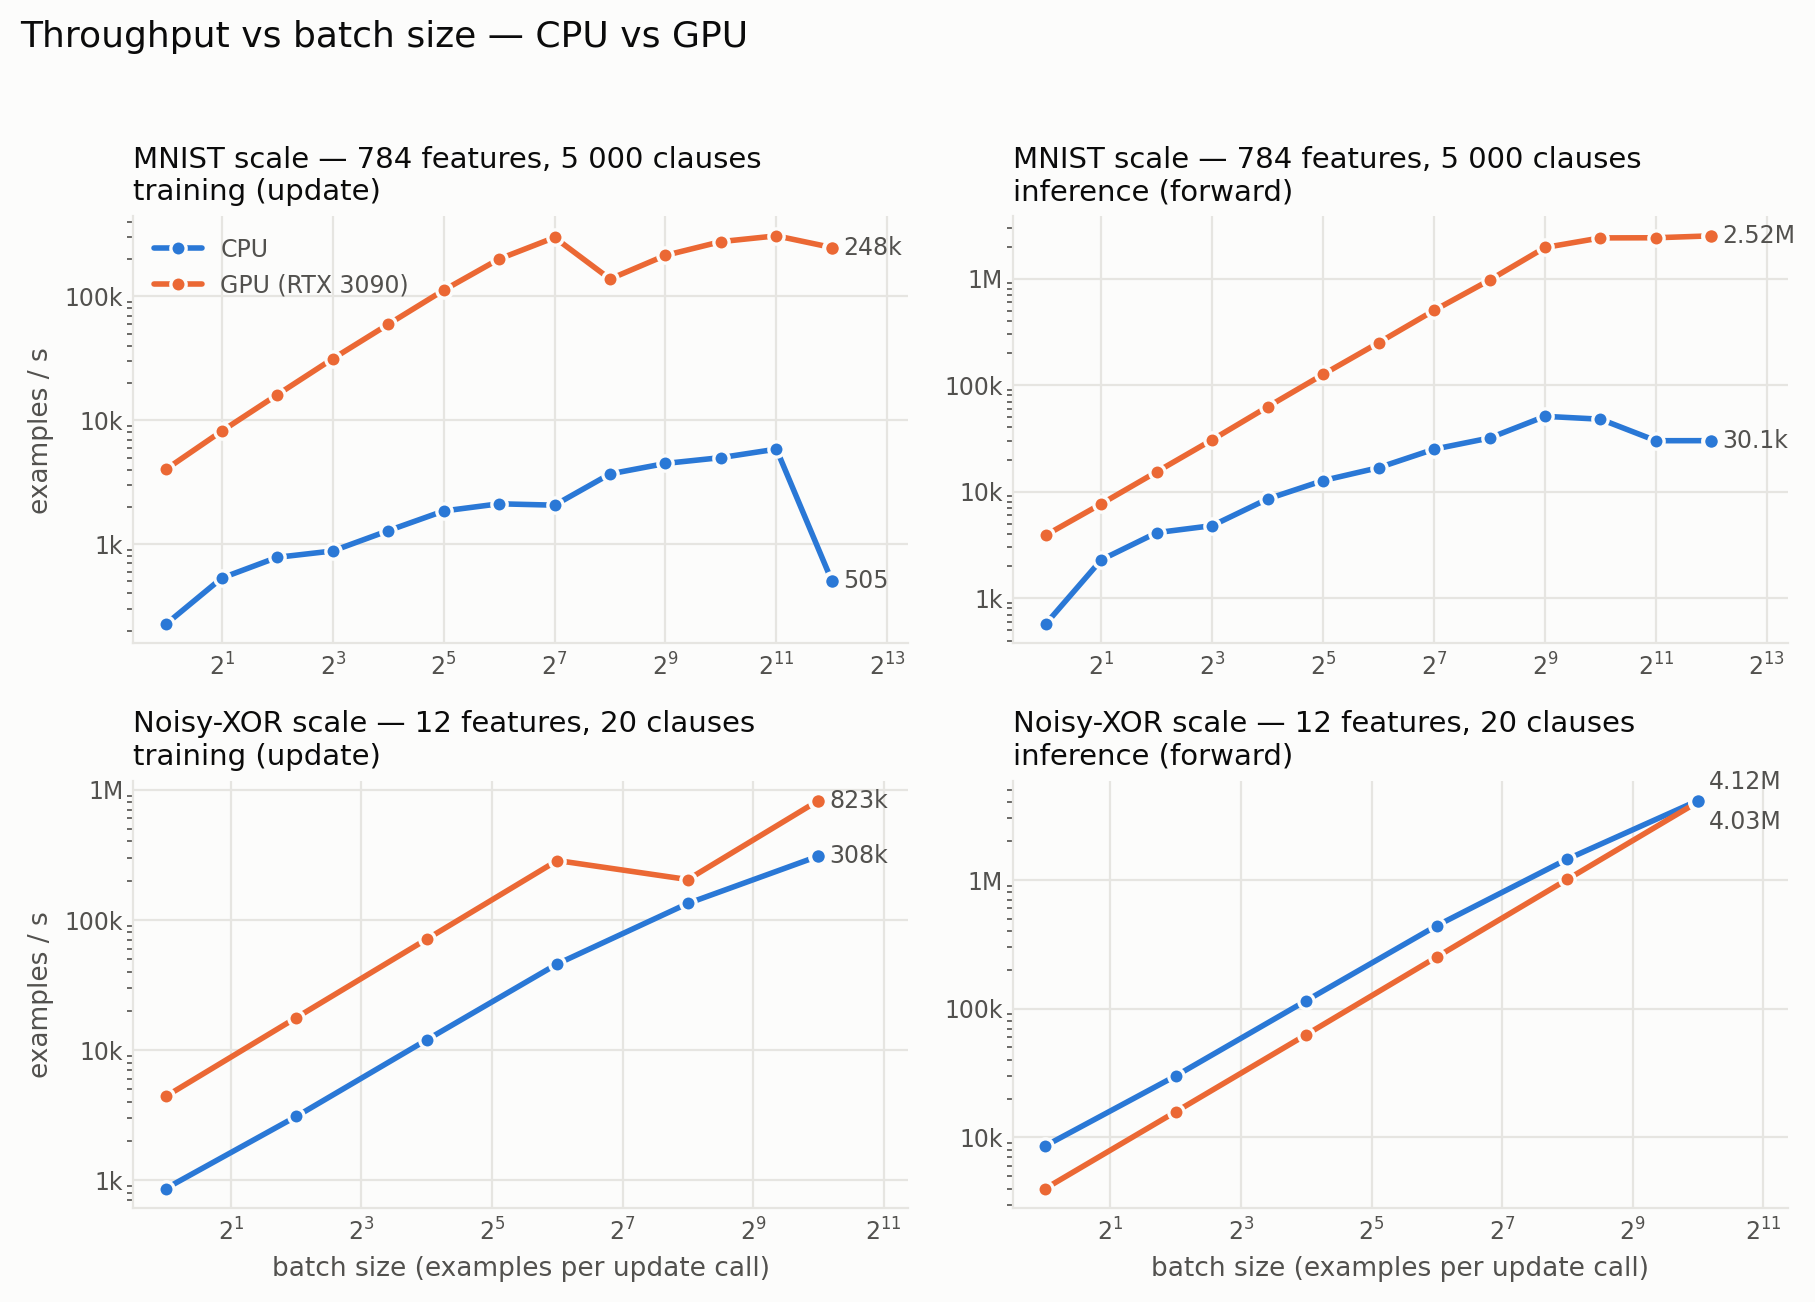
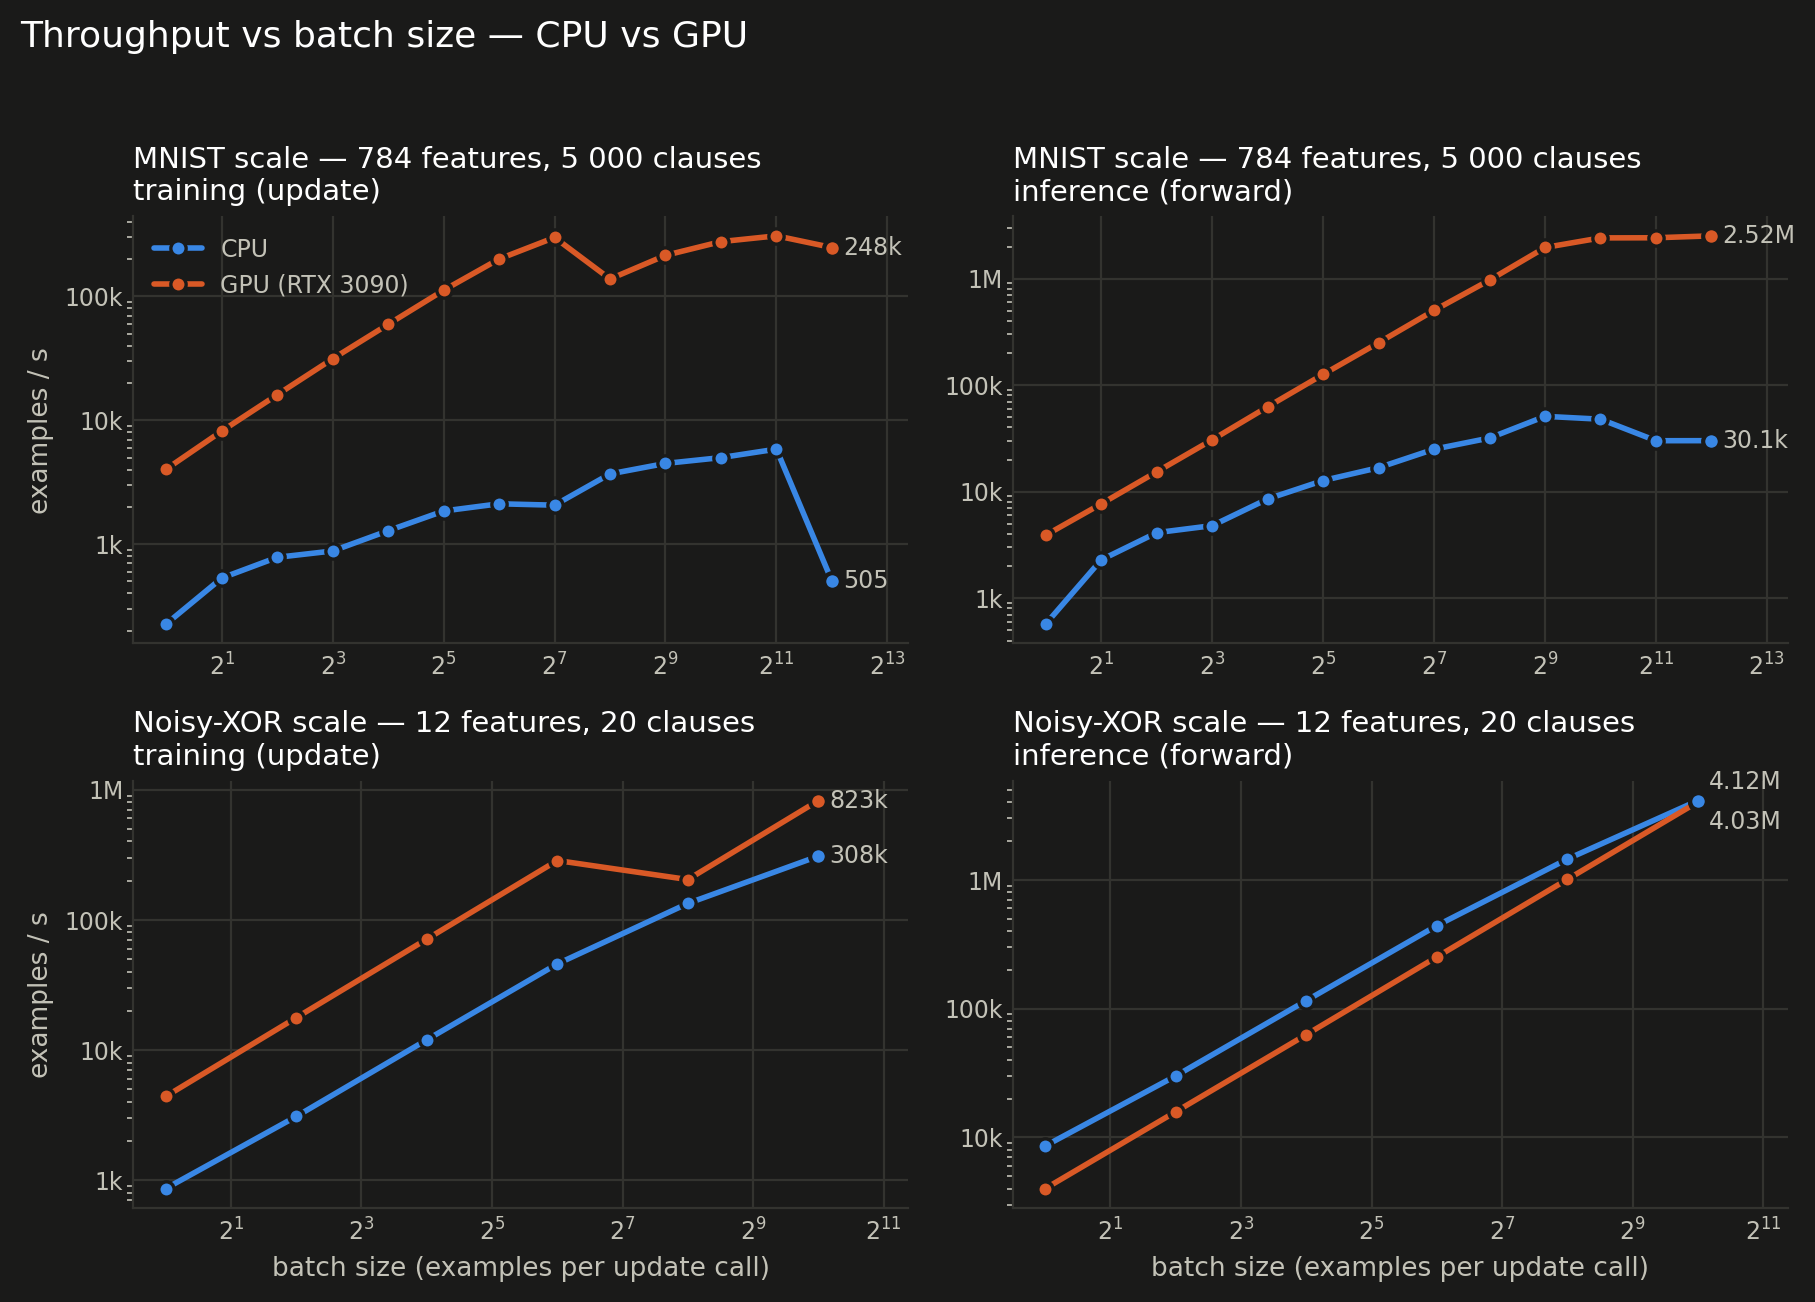
One update() call touches every automaton in the machine, so its cost depends far more on the size of the machine than on how many examples are in the batch. Feeding the GPU more examples per call is therefore nearly free: training throughput rises from 4,042 examples/s at batch 1 to 248,421 at batch 4096. At batch 256 the same model trains 138,358 examples/s on the GPU against 3,692 on the CPU (37×).
The Noisy-XOR scale machine in the bottom row is the counter-example: 20 clauses over 12 features is less work than a kernel launch, so only past batch 1 does the GPU pull ahead. Small machines belong on the CPU.
Batch size — MNIST scale (784 features, 500 clauses/class)
| batch | CPU train ex/s | GPU train ex/s | train speedup | CPU infer ex/s | GPU infer ex/s | infer speedup |
|---|---|---|---|---|---|---|
| 1 | 228 | 4,042 | 17.8× | 574 | 3,906 | 6.8× |
| 2 | 533 | 8,187 | 15.4× | 2,290 | 7,680 | 3.4× |
| 4 | 783 | 16,086 | 20.5× | 4,118 | 15,358 | 3.7× |
| 8 | 881 | 31,405 | 35.6× | 4,793 | 30,683 | 6.4× |
| 16 | 1,285 | 59,537 | 46.3× | 8,536 | 62,631 | 7.3× |
| 32 | 1,853 | 112,278 | 60.6× | 12,708 | 126,117 | 9.9× |
| 64 | 2,119 | 200,553 | 94.6× | 16,779 | 250,169 | 14.9× |
| 128 | 2,065 | 299,217 | 144.9× | 25,023 | 502,813 | 20.1× |
| 256 | 3,692 | 138,358 | 37.5× | 31,858 | 968,265 | 30.4× |
| 512 | 4,487 | 214,686 | 47.8× | 50,911 | 1,958,782 | 38.5× |
| 1,024 | 5,000 | 277,166 | 55.4× | 47,860 | 2,410,515 | 50.4× |
| 2,048 | 5,854 | 308,585 | 52.7× | 30,055 | 2,417,111 | 80.4× |
| 4,096 | 505 | 248,421 | 491.9× | 30,085 | 2,520,419 | 83.8× |
Batch size — Noisy-XOR scale (12 features, 10 clauses/class)
| batch | CPU train ex/s | GPU train ex/s | train speedup | CPU infer ex/s | GPU infer ex/s | infer speedup |
|---|---|---|---|---|---|---|
| 1 | 864 | 4,403 | 5.1× | 8,572 | 3,998 | 0.5× |
| 4 | 3,090 | 17,714 | 5.7× | 29,995 | 15,801 | 0.5× |
| 16 | 11,979 | 71,039 | 5.9× | 115,284 | 62,742 | 0.5× |
| 64 | 45,845 | 285,206 | 6.2× | 440,671 | 251,805 | 0.6× |
| 256 | 133,553 | 203,689 | 1.5× | 1,448,447 | 1,007,928 | 0.7× |
| 1,024 | 308,262 | 822,790 | 2.7× | 4,124,239 | 4,026,418 | 1.0× |
How much the GPU buys you
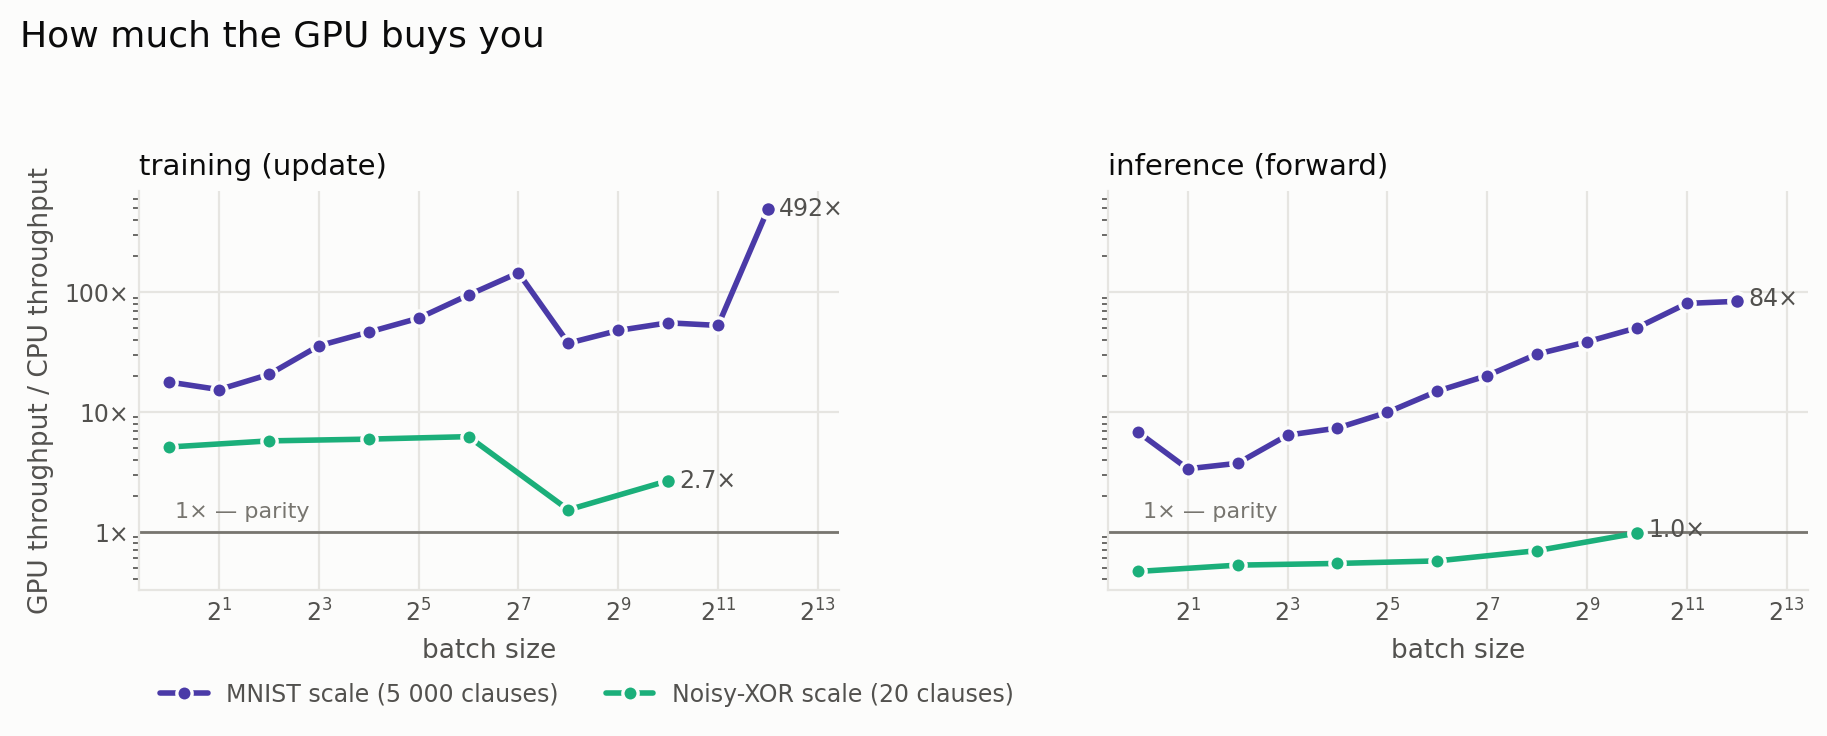
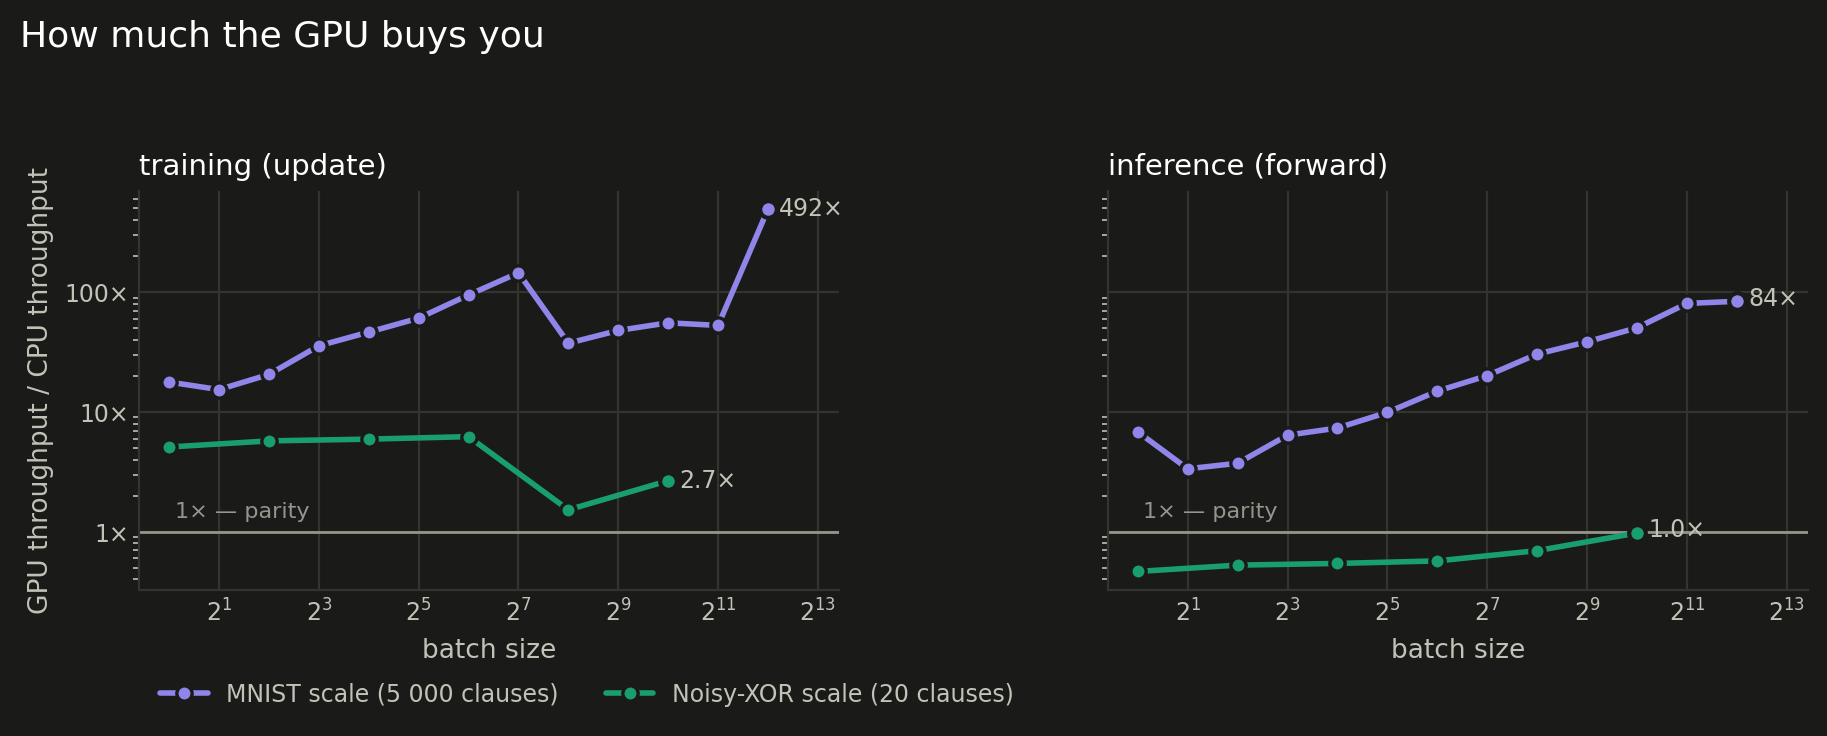
The speedup is not one number. It grows with batch size because the CPU pays the per-clause cost serially while the GPU hides it, peaks at about 492× around batch 4096, and holds from there. Inference behaves differently again: the CPU forward pass is already cheap, so the gap there tops out at 84× — worth having, but not the same kind of difference.
Throughput vs model size
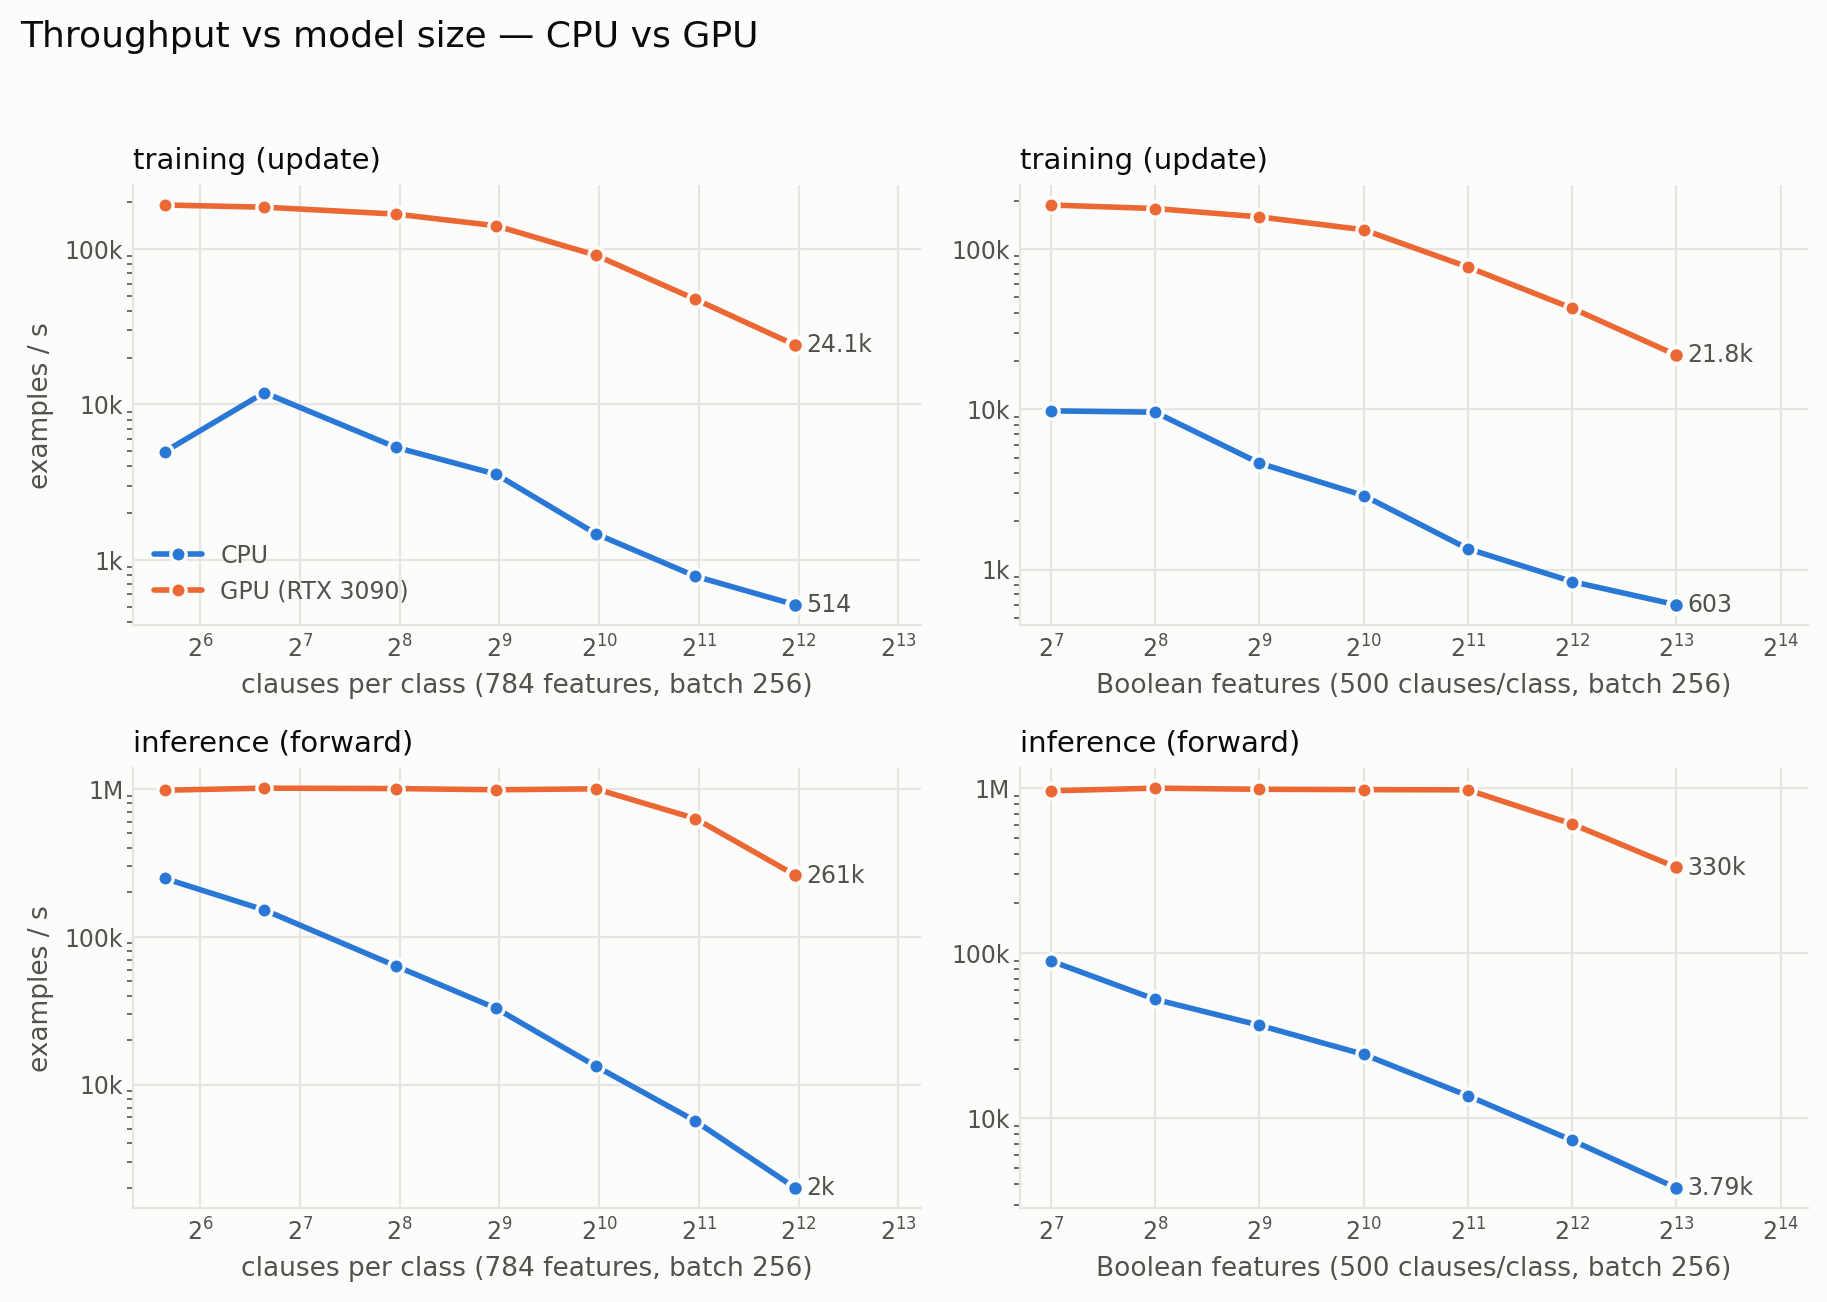
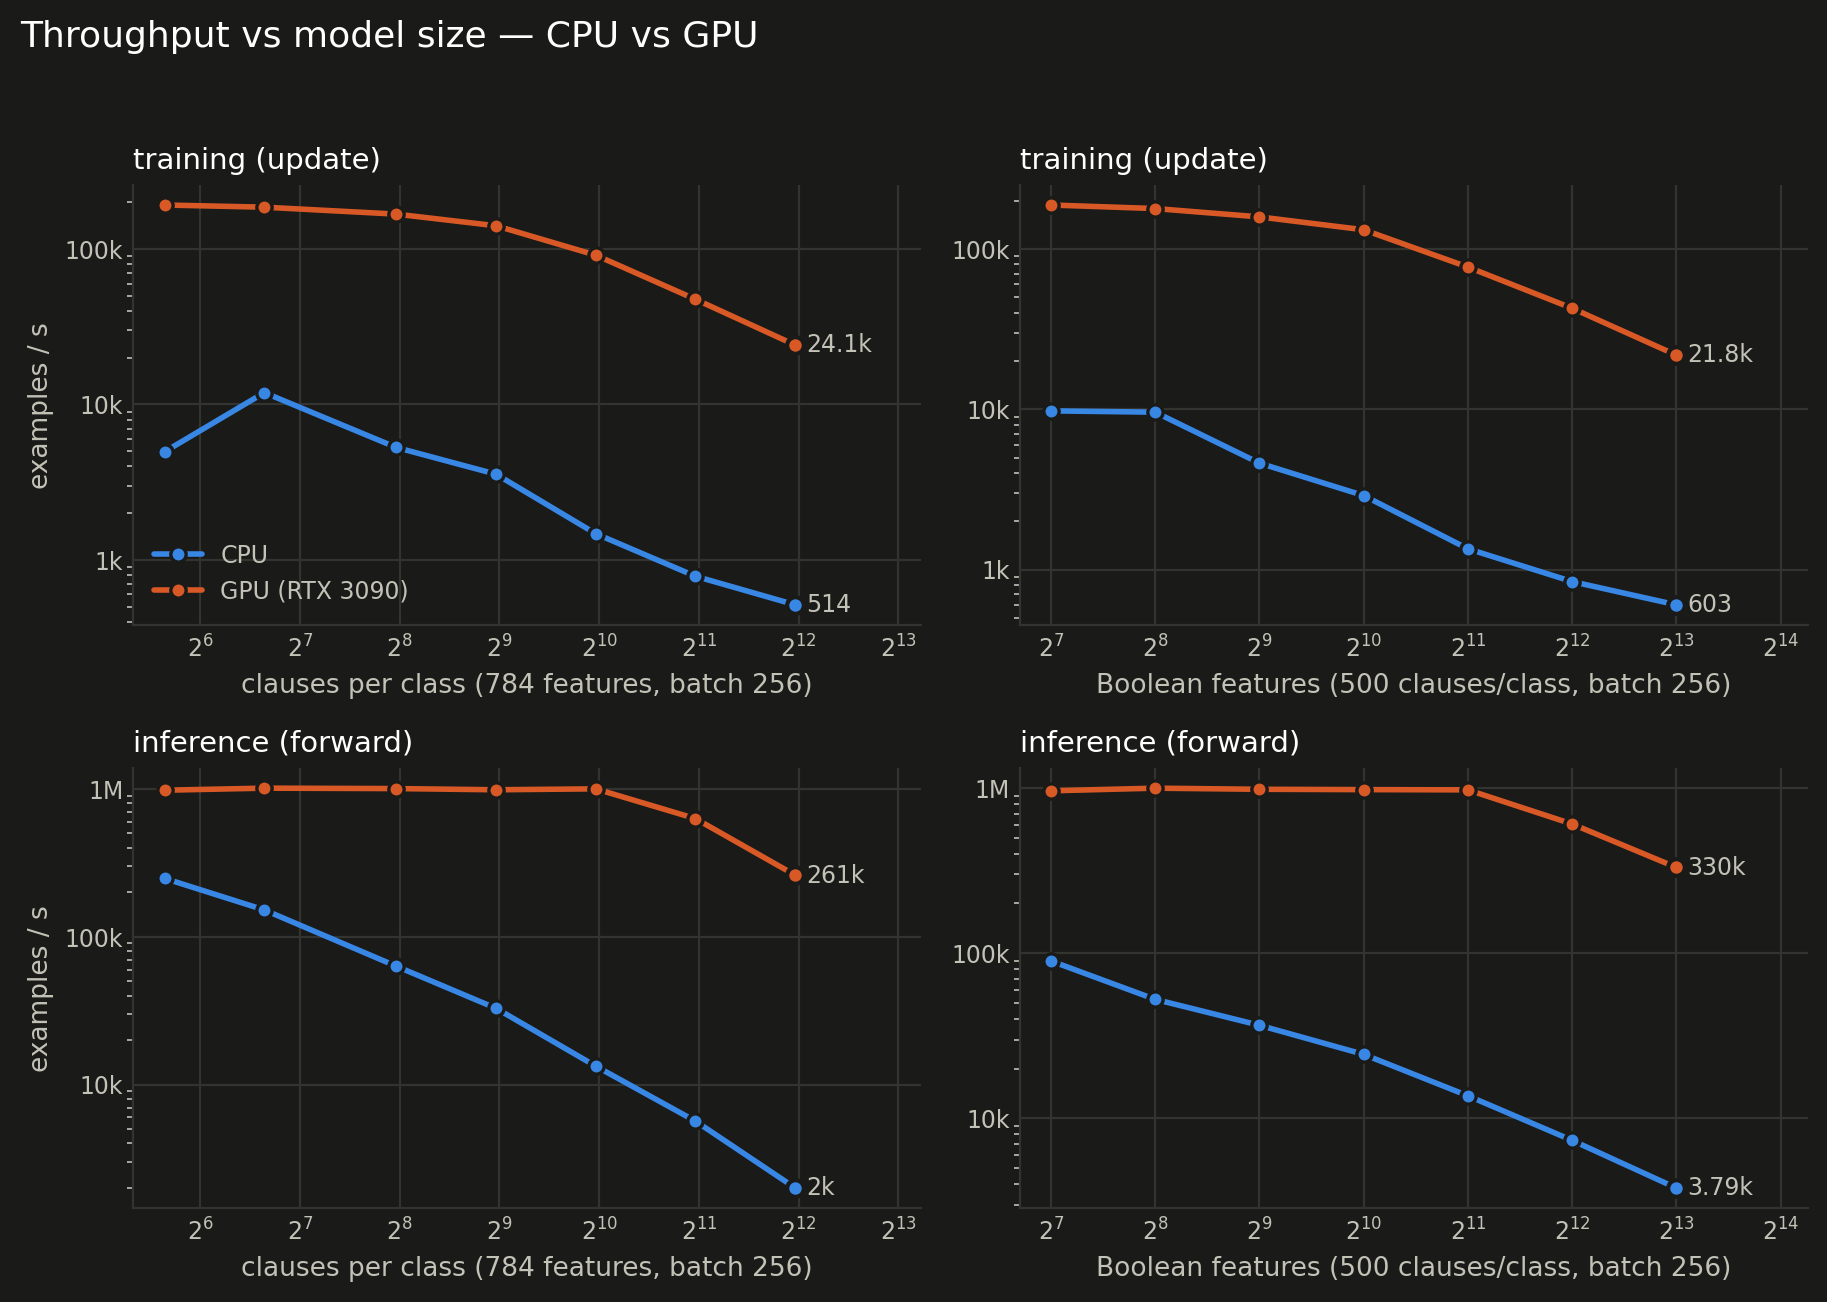
Both axes cost the same thing — the update is n_clauses × 2 × n_features element-wise work — so both curves fall roughly as 1/x. The CPU falls off immediately; the GPU stays flat until the machine is big enough to fill it, which is why the gap widens with model size: 39× at 50 clauses/class against 47× at 4000; 19× at 128 features against 36× at 8192. Big machines are exactly the ones worth moving to a GPU.
Clause budget (784 features, batch 256)
| clauses/class | CPU train ex/s | GPU train ex/s | train speedup | CPU infer ex/s | GPU infer ex/s | infer speedup |
|---|---|---|---|---|---|---|
| 50 | 4,961 | 192,140 | 38.7× | 248,098 | 979,219 | 3.9× |
| 100 | 11,918 | 186,057 | 15.6× | 151,742 | 1,011,026 | 6.7× |
| 250 | 5,290 | 167,860 | 31.7× | 63,210 | 1,004,436 | 15.9× |
| 500 | 3,560 | 141,289 | 39.7× | 32,815 | 985,867 | 30.0× |
| 1,000 | 1,474 | 91,372 | 62.0× | 13,330 | 1,000,287 | 75.0× |
| 2,000 | 784 | 47,474 | 60.6× | 5,661 | 629,095 | 111.1× |
| 4,000 | 514 | 24,116 | 46.9× | 1,999 | 260,728 | 130.4× |
Feature count (500 clauses/class, batch 256)
| features | CPU train ex/s | GPU train ex/s | train speedup | CPU infer ex/s | GPU infer ex/s | infer speedup |
|---|---|---|---|---|---|---|
| 128 | 9,768 | 187,734 | 19.2× | 89,701 | 960,951 | 10.7× |
| 256 | 9,587 | 178,397 | 18.6× | 52,506 | 997,185 | 19.0× |
| 512 | 4,613 | 158,266 | 34.3× | 36,591 | 981,522 | 26.8× |
| 1,024 | 2,897 | 131,572 | 45.4× | 24,392 | 977,050 | 40.1× |
| 2,048 | 1,349 | 77,025 | 57.1× | 13,695 | 973,727 | 71.1× |
| 4,096 | 842 | 42,651 | 50.6× | 7,355 | 605,203 | 82.3× |
| 8,192 | 603 | 21,766 | 36.1× | 3,787 | 330,395 | 87.2× |
The model zoo
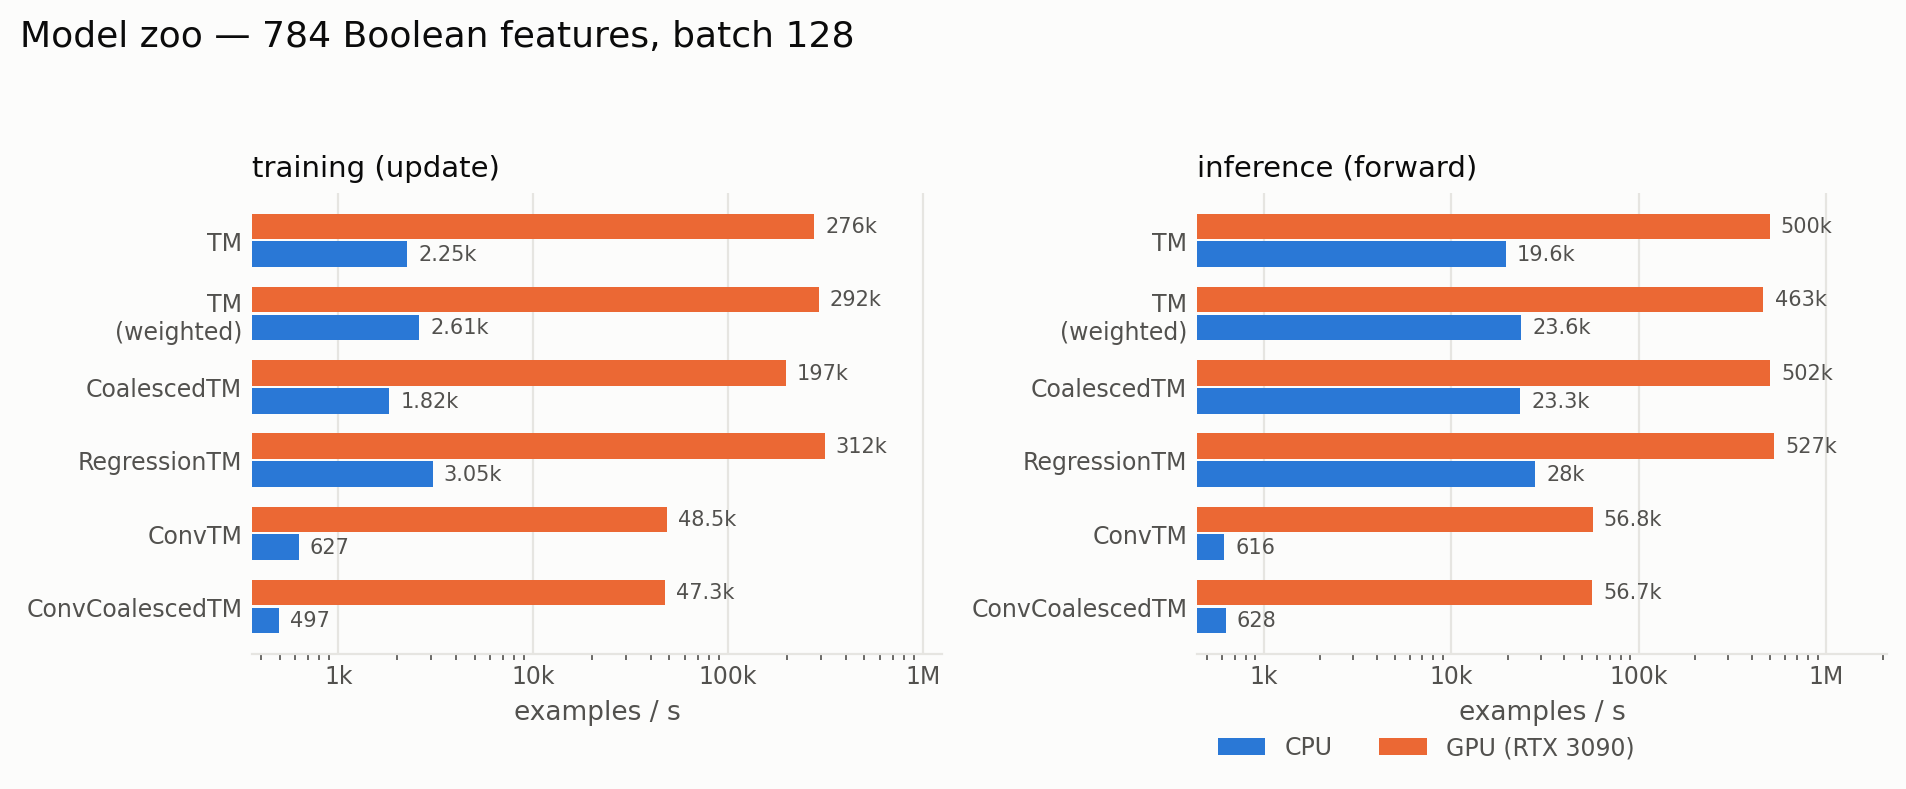
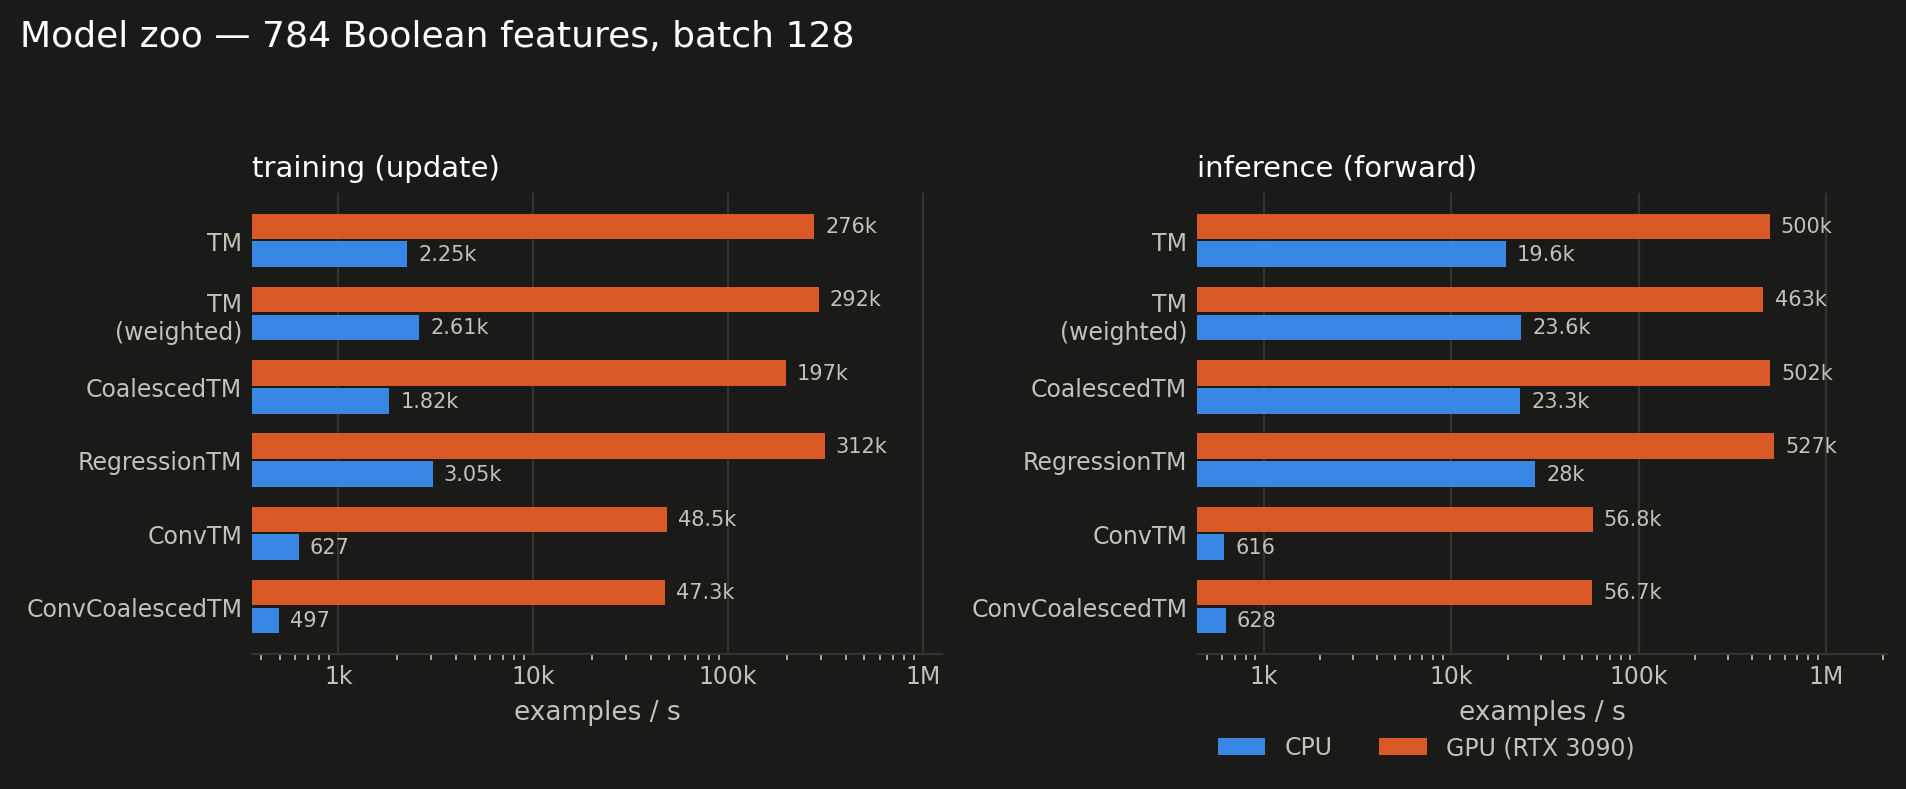
Weighted and coalesced variants cost about what the plain machine costs: they change the output layer and the feedback policy, not the per-clause work that dominates. The convolutional models are the outlier at 6× the cost of the flat machine per example — a 10×10 patch over a 28×28 image is 361 patches, and every patch is evaluated against every clause.
Model zoo (784 features, batch 128)
| model | CPU train ex/s | GPU train ex/s | train speedup | CPU infer ex/s | GPU infer ex/s | infer speedup | GPU peak memory |
|---|---|---|---|---|---|---|---|
| TsetlinMachine | 2,251 | 275,696 | 122× | 19,614 | 500,053 | 25× | 55 MB |
| TsetlinMachine (weighted) | 2,608 | 292,007 | 112× | 23,596 | 462,666 | 20× | 56 MB |
| CoalescedTsetlinMachine | 1,823 | 197,189 | 108× | 23,299 | 501,733 | 22× | 64 MB |
| RegressionTsetlinMachine | 3,047 | 312,436 | 103× | 27,998 | 527,448 | 19× | 56 MB |
| ConvTsetlinMachine | 627 | 48,537 | 77× | 616 | 56,769 | 92× | 167 MB |
| ConvCoalescedTsetlinMachine | 497 | 47,276 | 95× | 628 | 56,652 | 90× | 167 MB |
Where an update goes
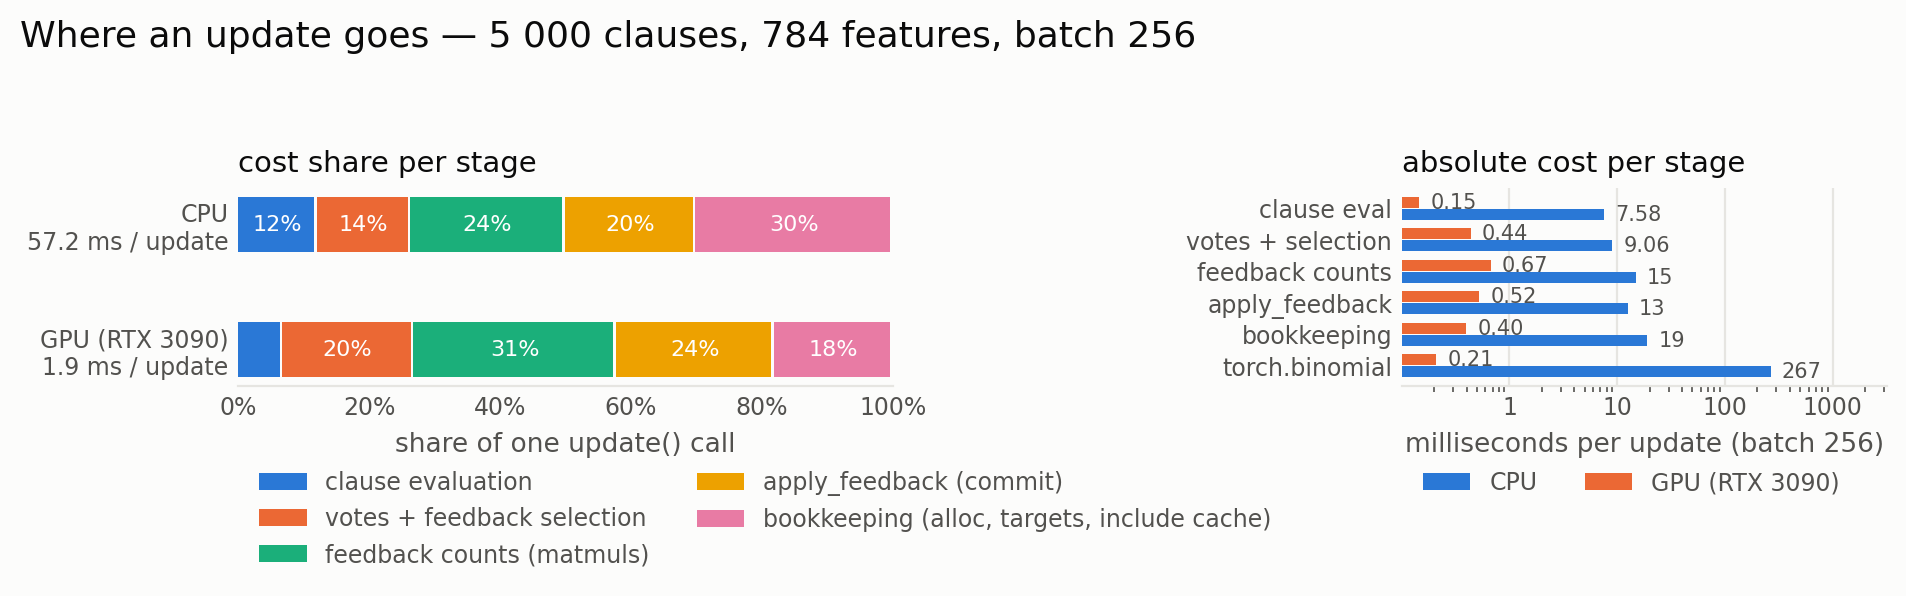
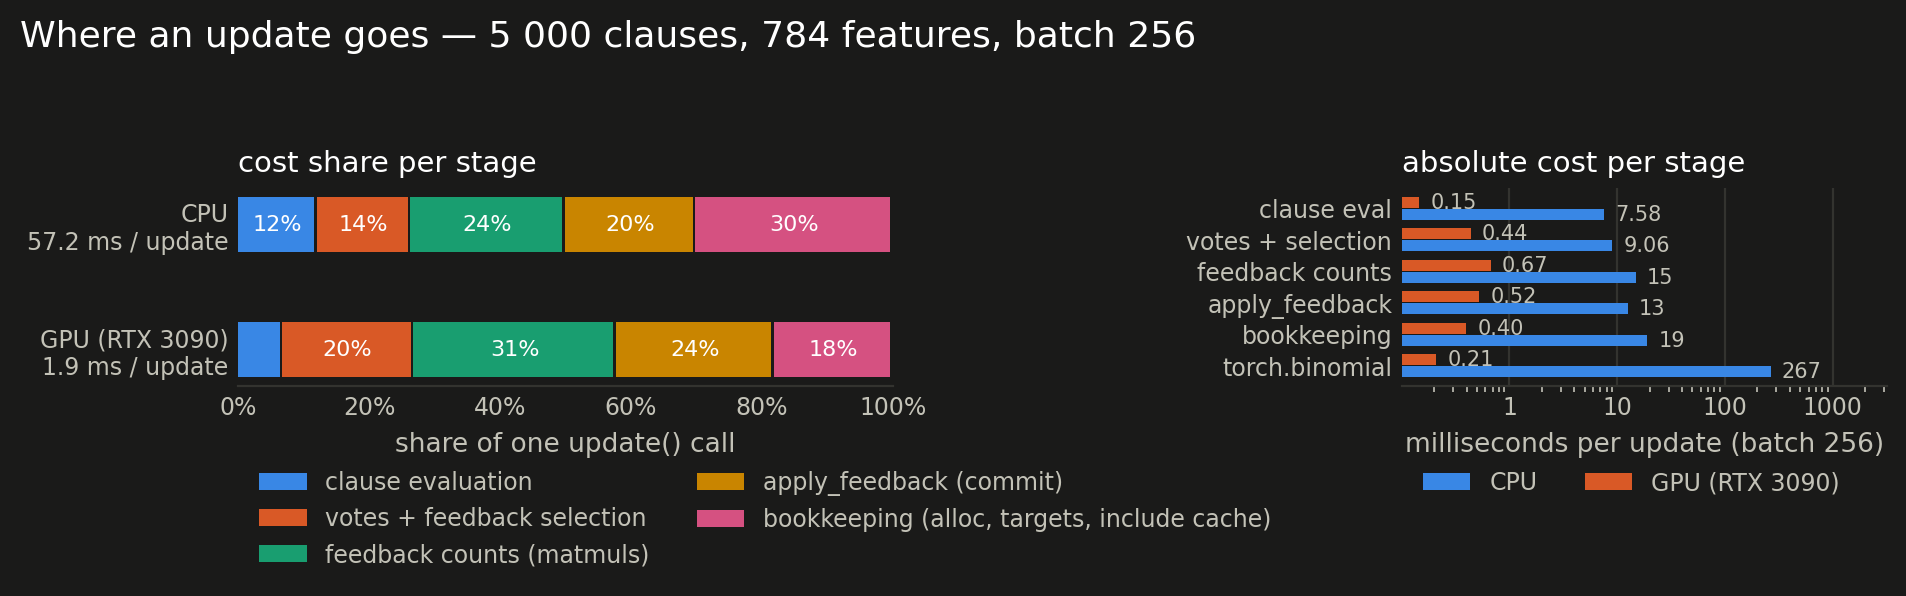
apply_feedback — the stochastic increment/decrement of the whole (n_clauses, 2F) automaton state — is the expensive part of an update: on the CPU it is 22 % of the 57.2 ms call; on the GPU it is 28 % of the 1.9 ms call. A standalone torch.binomial draw of the same (C, 2F) shape costs 266.65 ms on the CPU and 0.21 ms on the GPU — the single most expensive op in the commit. Everything before the commit (encoding, clause evaluation, the vote sums and the feedback count matmuls) is comparatively cheap. That is also why batching pays: a batched update draws once per commit, a sequential one draws once per example.
Update cost breakdown (5 000 clauses, 784 features, batch 256)
| stage | cpu (ms) | cuda:0 (ms) |
|---|---|---|
| encode | 0.075 | 0.038 |
| evaluate | 7.508 | 0.108 |
| votes+select | 9.059 | 0.436 |
| feedback_counts | 14.962 | 0.675 |
| accumulator_alloc | 3.800 | 0.117 |
| coerce_targets | 0.009 | 0.052 |
| apply_feedback | 12.591 | 0.525 |
| refresh_include | 15.303 | 0.227 |
| commit | 27.903 | 0.803 |
| torch.binomial (C x 2F) | 266.648 | 0.209 |
| update() total | 57.181 | 1.876 |
CPU thread scaling
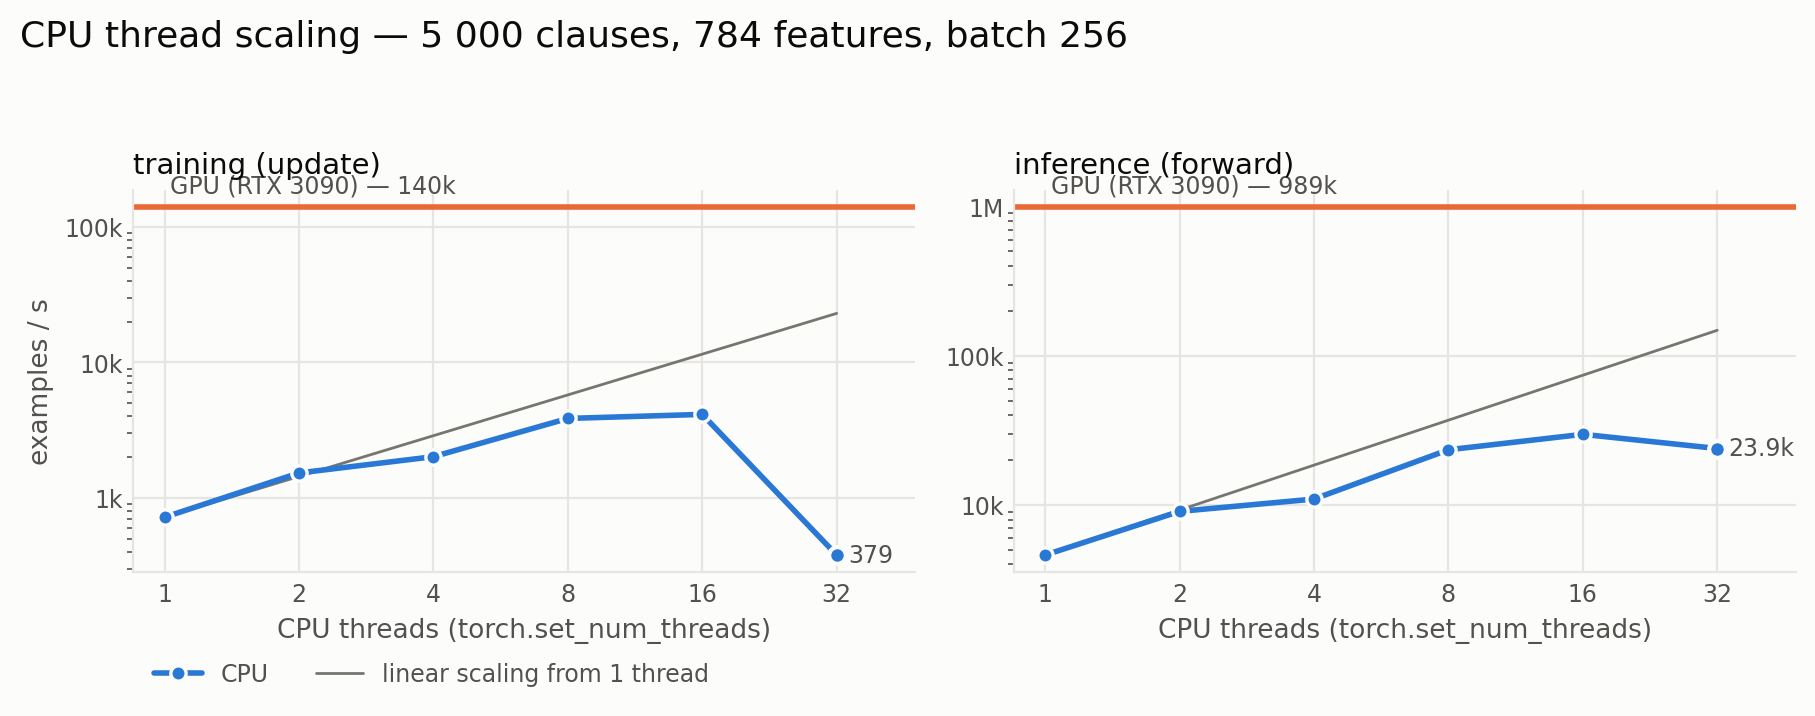
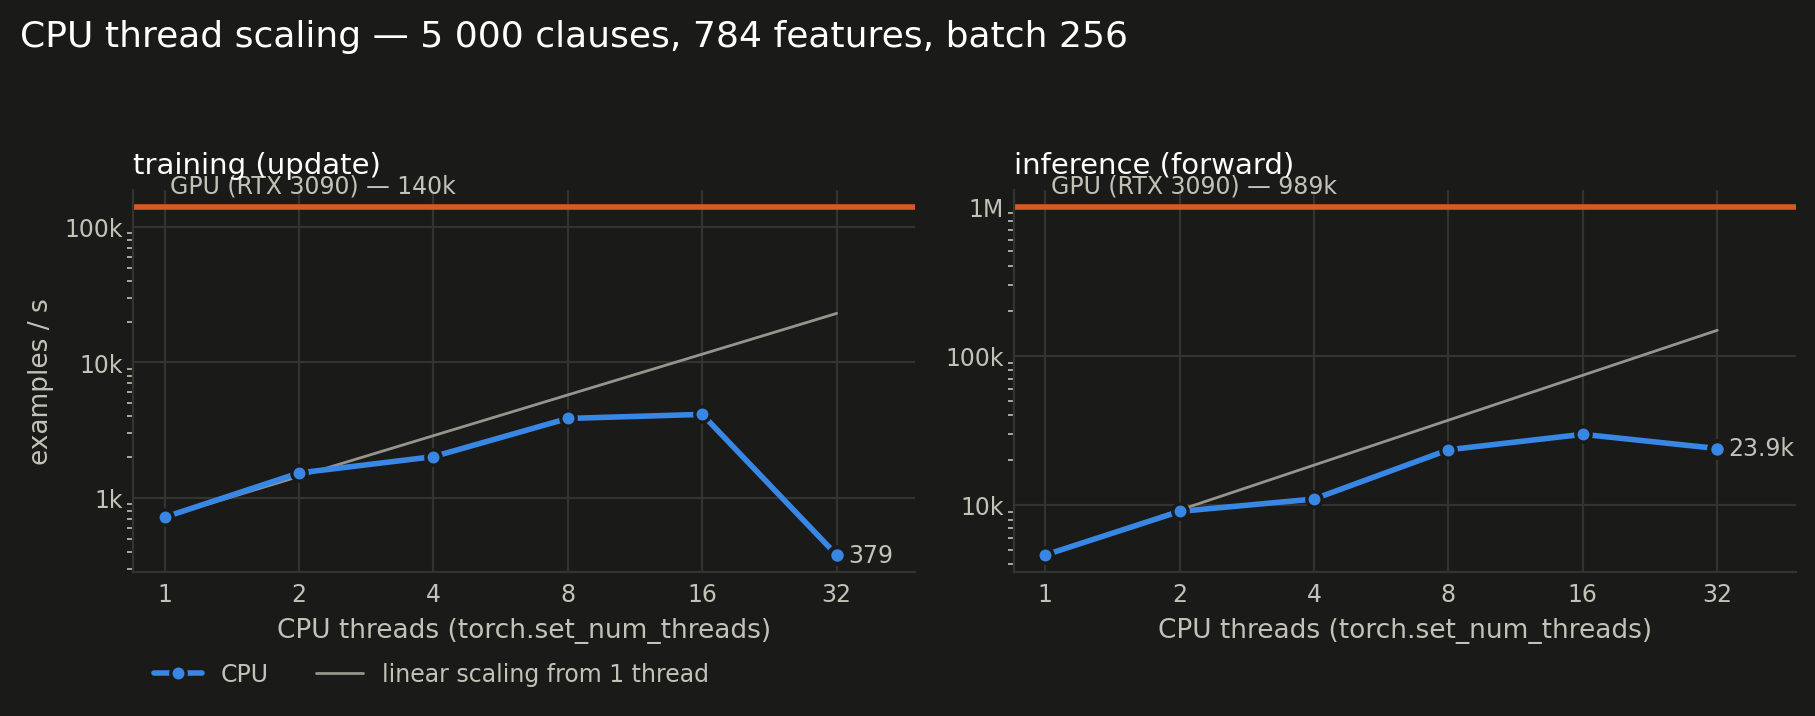
More CPU threads buy surprisingly little in training: 0.5× going from 1 to 32 threads. The batched update is a chain of large element-wise ops over the state, and the binomial draw that dominates it does not thread. Inference scales much better (5.2× over the same range): the forward pass is one big matmul-shaped reduction. If a CPU run is too slow, the lever is the clause budget or the batch size, not torch.set_num_threads.
CPU thread scaling (5 000 clauses, 784 features, batch 256)
| threads | train ex/s | infer ex/s |
|---|---|---|
| 1 | 720 | 4,629 |
| 2 | 1,528 | 9,072 |
| 4 | 2,015 | 10,974 |
| 8 | 3,860 | 23,464 |
| 16 | 4,136 | 29,778 |
| 32 | 379 | 23,923 |
Batched vs sequential feedback
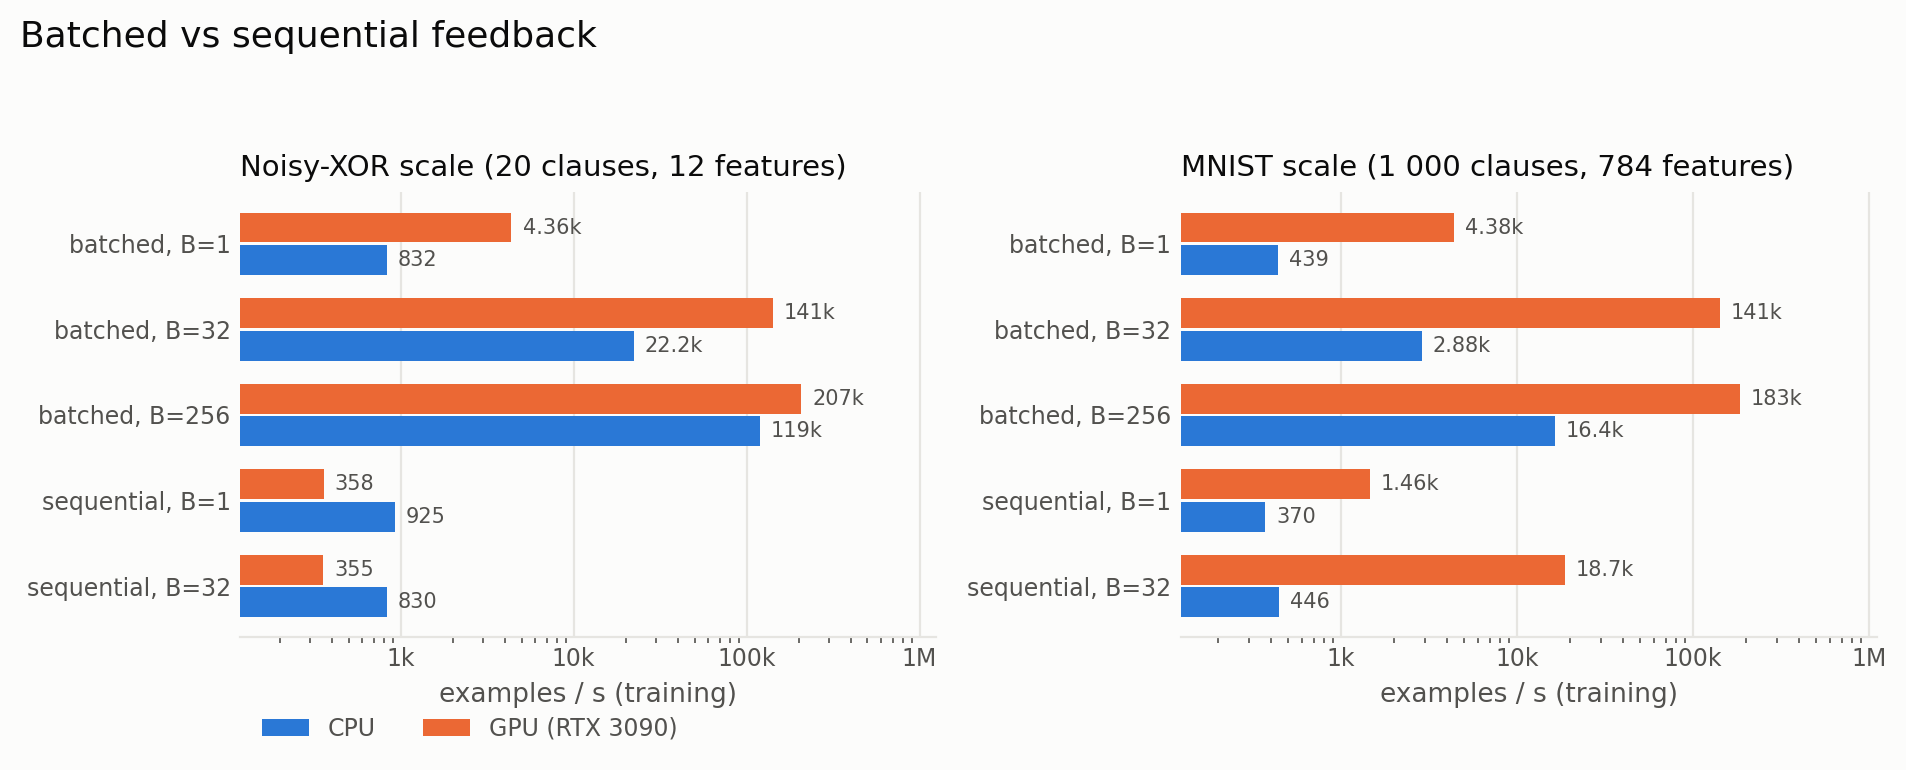
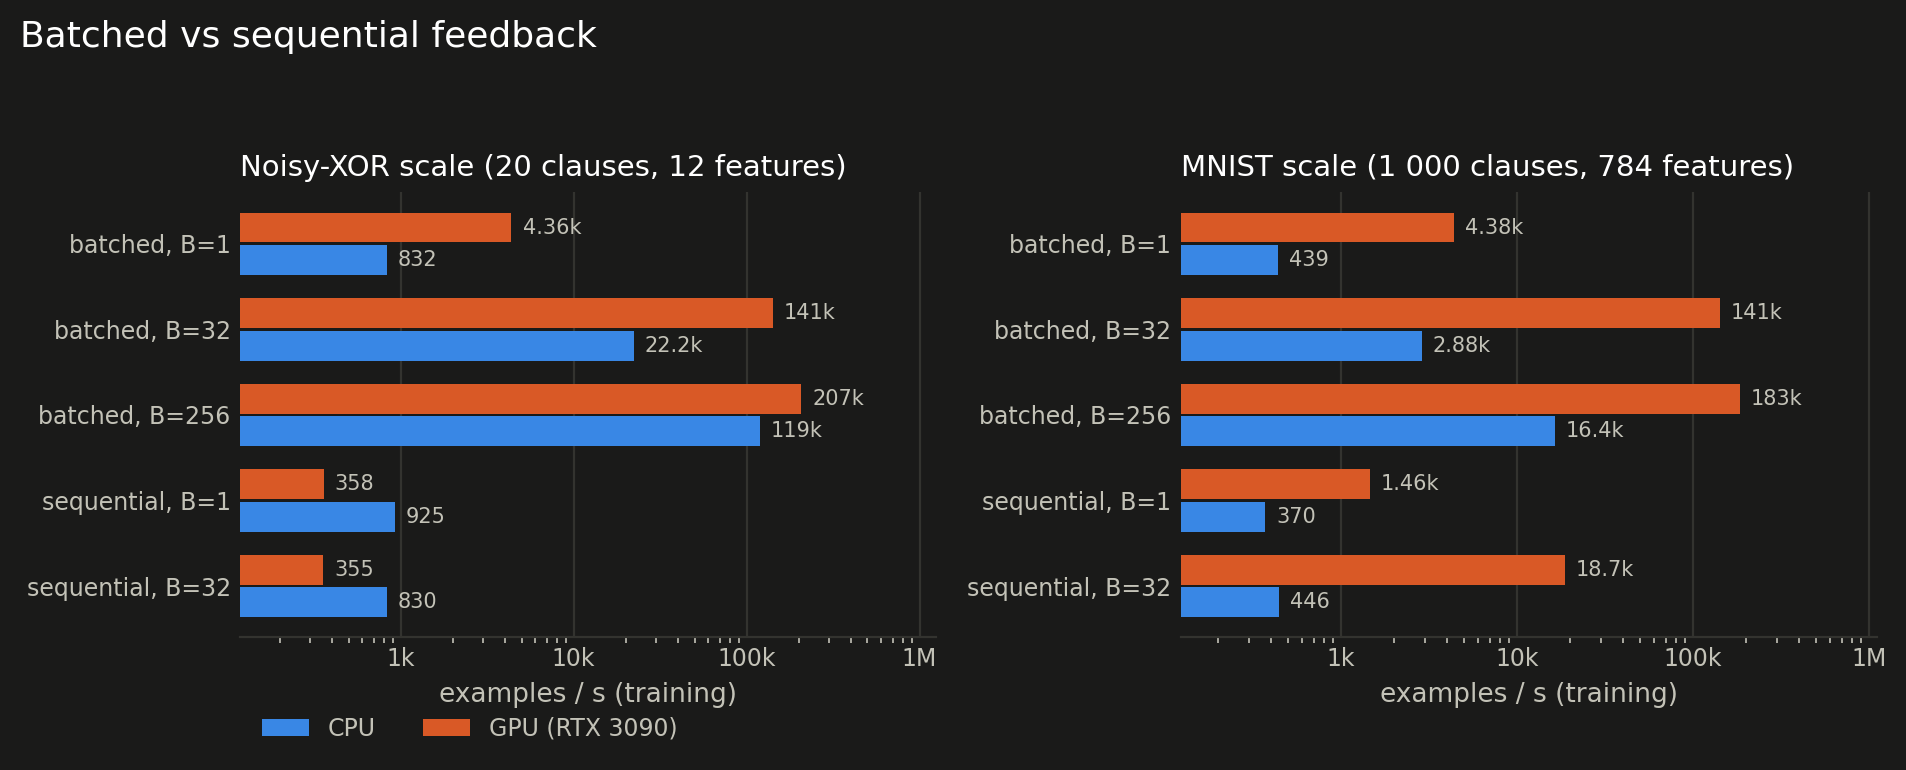
feedback_mode="sequential" is the exact per-example algorithm: it commits once per example, so a mini-batch of 32 pays 32 commits instead of one. Measured at batch 32 that is 6-399× slower than the batched update, depending on the model scale and the device. Batching is the default for that reason — but it is an approximation, and its fidelity degrades as the batch grows. See Batched vs sequential feedback for the accuracy side of this trade.
Batched vs sequential feedback
| scale | feedback_mode | batch | device | examples/s | ms / update call |
|---|---|---|---|---|---|
| mnist-1k | batch | 1 | cpu | 439 | 2.28 |
| mnist-1k | batch | 1 | cuda:0 | 4,377 | 0.23 |
| mnist-1k | batch | 32 | cpu | 2,878 | 11.12 |
| mnist-1k | batch | 32 | cuda:0 | 141,337 | 0.23 |
| mnist-1k | batch | 256 | cpu | 16,428 | 15.58 |
| mnist-1k | batch | 256 | cuda:0 | 183,495 | 1.40 |
| mnist-1k | sequential | 1 | cpu | 370 | 2.70 |
| mnist-1k | sequential | 1 | cuda:0 | 1,456 | 0.69 |
| mnist-1k | sequential | 32 | cpu | 446 | 71.72 |
| mnist-1k | sequential | 32 | cuda:0 | 18,667 | 1.71 |
| xor | batch | 1 | cpu | 832 | 1.20 |
| xor | batch | 1 | cuda:0 | 4,364 | 0.23 |
| xor | batch | 32 | cpu | 22,225 | 1.44 |
| xor | batch | 32 | cuda:0 | 141,475 | 0.23 |
| xor | batch | 256 | cpu | 119,070 | 2.15 |
| xor | batch | 256 | cuda:0 | 207,292 | 1.23 |
| xor | sequential | 1 | cpu | 925 | 1.08 |
| xor | sequential | 1 | cuda:0 | 358 | 2.79 |
| xor | sequential | 32 | cpu | 830 | 38.57 |
| xor | sequential | 32 | cuda:0 | 355 | 90.20 |
Where the data lives
Keeping the Boolean dataset in host memory and copying each mini-batch across costs at most 4 % of throughput here — the update is long enough to hide the transfer. So stream a dataset that does not fit in VRAM without worrying, but do hand the model a device tensor: see Choosing a device for the one copy that does bite (Booleanization encoders keep their thresholds on the CPU).
Host- vs device-resident data (training, 784 features, 500 clauses/class)
| device | batch | dataset lives on | examples/s | ms / update |
|---|---|---|---|---|
| cpu | 32 | device | 1,420 | 22.54 |
| cpu | 32 | host | 1,366 | 23.43 |
| cpu | 256 | device | 3,538 | 72.36 |
| cpu | 256 | host | 3,570 | 71.70 |
| cpu | 2048 | device | 5,268 | 388.80 |
| cpu | 2048 | host | 5,719 | 358.10 |
| cuda:0 | 32 | device | 101,124 | 0.32 |
| cuda:0 | 32 | host | 104,502 | 0.31 |
| cuda:0 | 256 | device | 136,039 | 1.88 |
| cuda:0 | 256 | host | 135,599 | 1.89 |
| cuda:0 | 2048 | device | 305,019 | 6.71 |
| cuda:0 | 2048 | host | 301,221 | 6.80 |
Dense segmentation
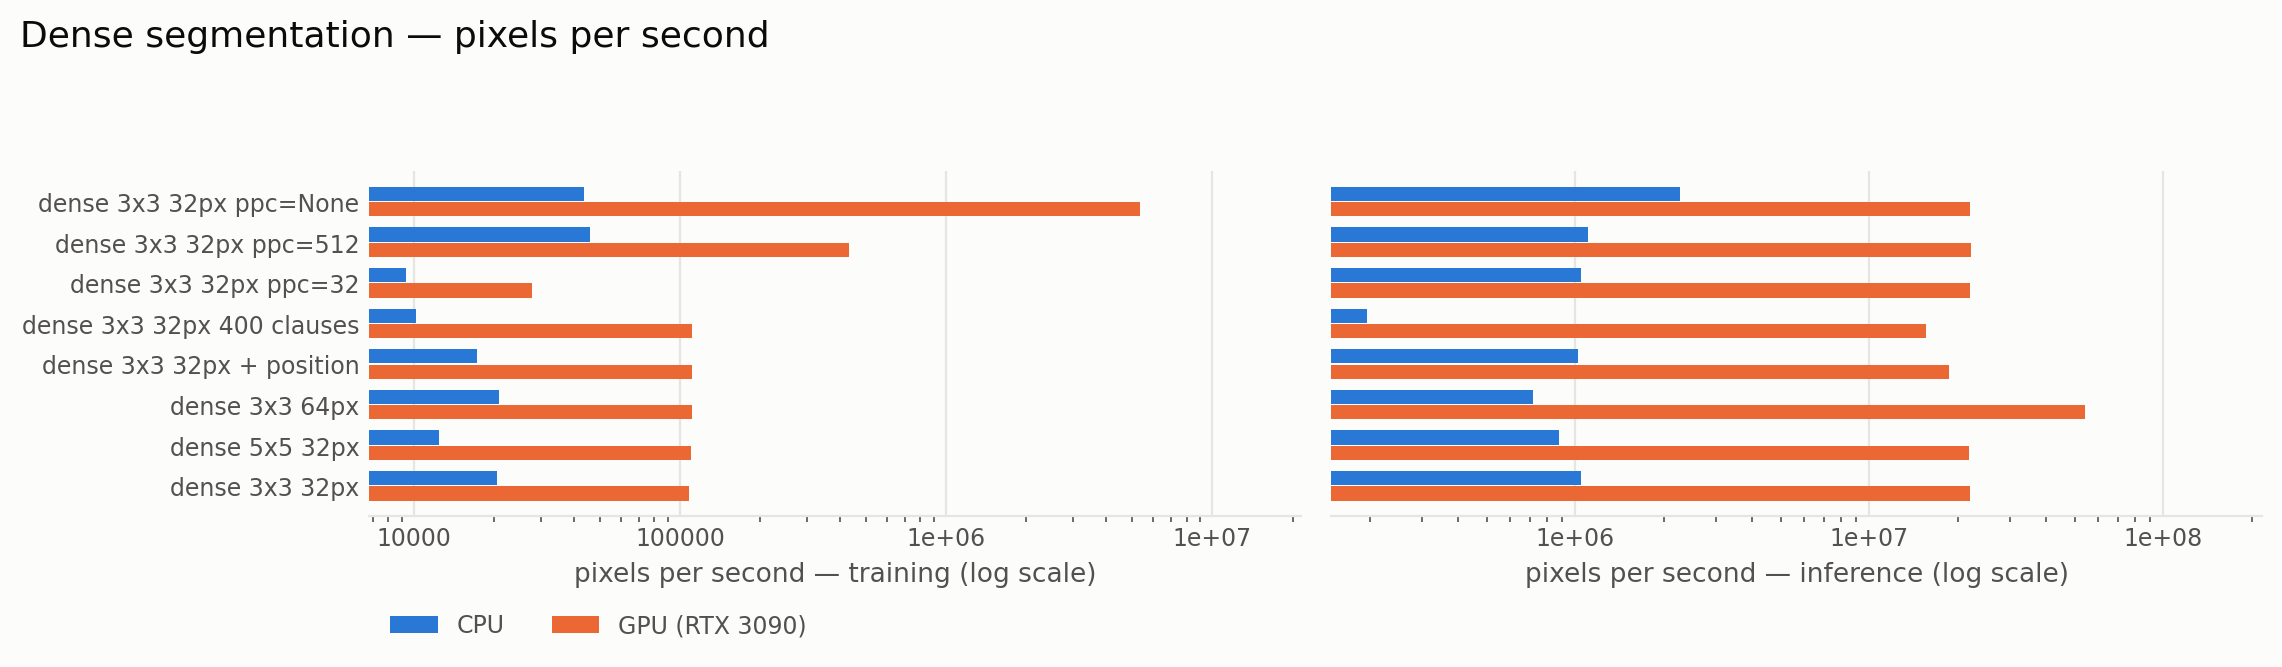
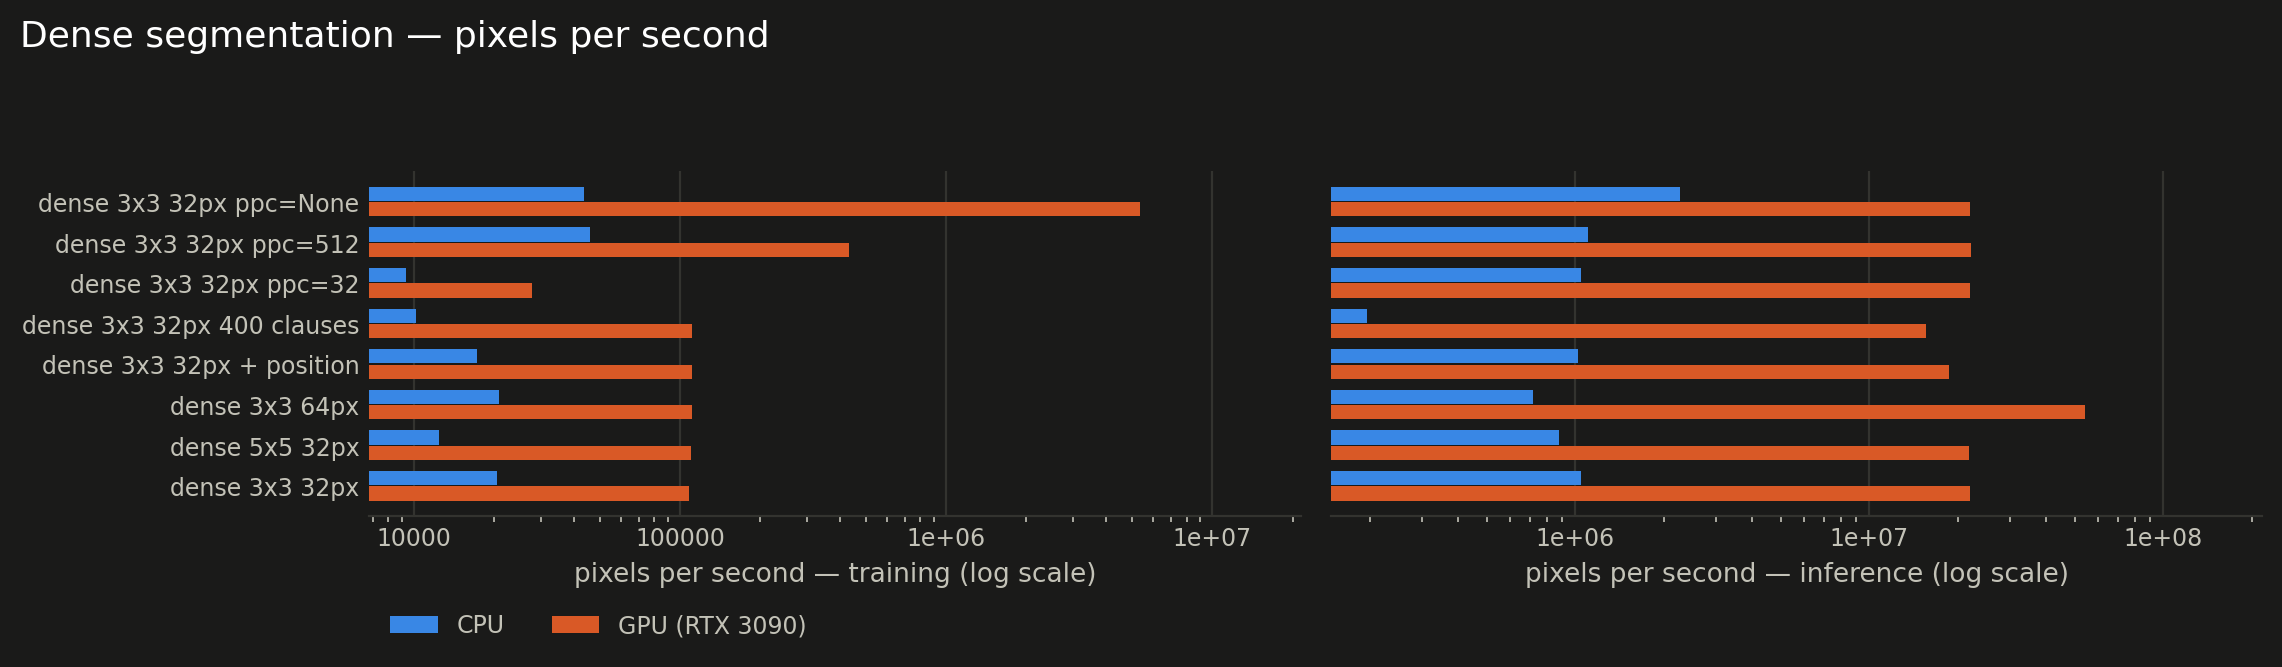
Dense prediction evaluates one patch per pixel, so throughput is quoted in pixels per second rather than examples per second — one 32×32 image is 1 024 examples.
- A 3×3 dense model on 32×32 inputs runs at 20,472 px/s training and 1,048,820 px/s predicting on CPU — prediction is roughly 51× cheaper, because it never draws feedback or touches the automata.
patches_per_commitis the price of fidelity: committing once per batch reaches 43,432 px/s against 20,472 at the default 128, a 2.1× speedup that costs real accuracy (see the segmentation guide's ablation).
Dense segmentation (4 planes, 4 classes, batch 8 images)
| configuration | patches/commit | CPU train px/s | GPU train px/s | train speedup | CPU infer px/s | GPU infer px/s | infer speedup |
|---|---|---|---|---|---|---|---|
| dense 3x3 32px | 128 | 20,472 | 107,750 | 5× | 1,048,820 | 21,982,433 | 21× |
| dense 5x5 32px | 128 | 12,402 | 109,839 | 9× | 876,901 | 21,861,851 | 25× |
| dense 3x3 64px | 128 | 20,813 | 111,119 | 5× | 716,707 | 54,257,194 | 76× |
| dense 3x3 32px + position | 128 | 17,291 | 111,121 | 6× | 1,022,430 | 18,601,999 | 18× |
| dense 3x3 32px 400 clauses | 128 | 10,172 | 111,073 | 11× | 195,079 | 15,617,485 | 80× |
| dense 3x3 32px ppc=32 | 32 | 9,329 | 27,881 | 3× | 1,047,587 | 21,967,614 | 21× |
| dense 3x3 32px ppc=512 | 512 | 45,850 | 429,667 | 9× | 1,107,562 | 22,158,173 | 20× |
| dense 3x3 32px ppc=None | all | 43,432 | 5,368,704 | 124× | 2,277,724 | 21,918,503 | 10× |
3D convolution
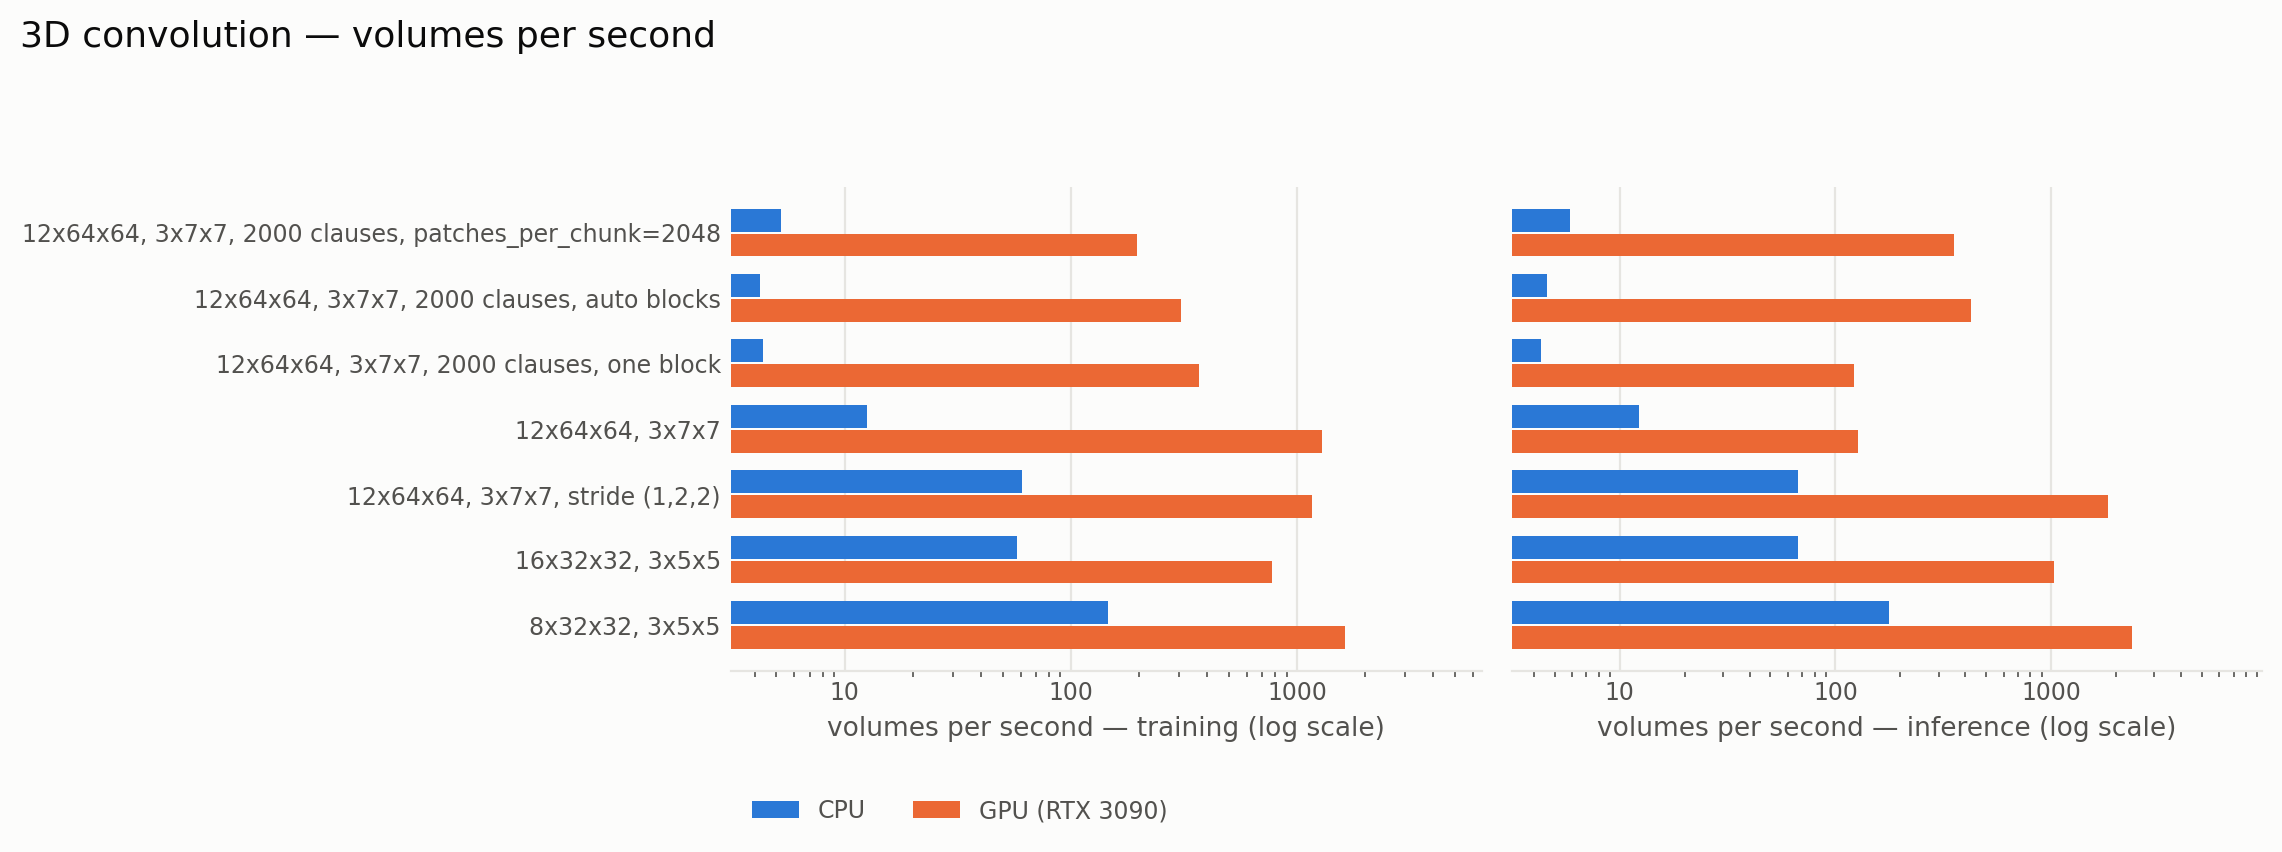
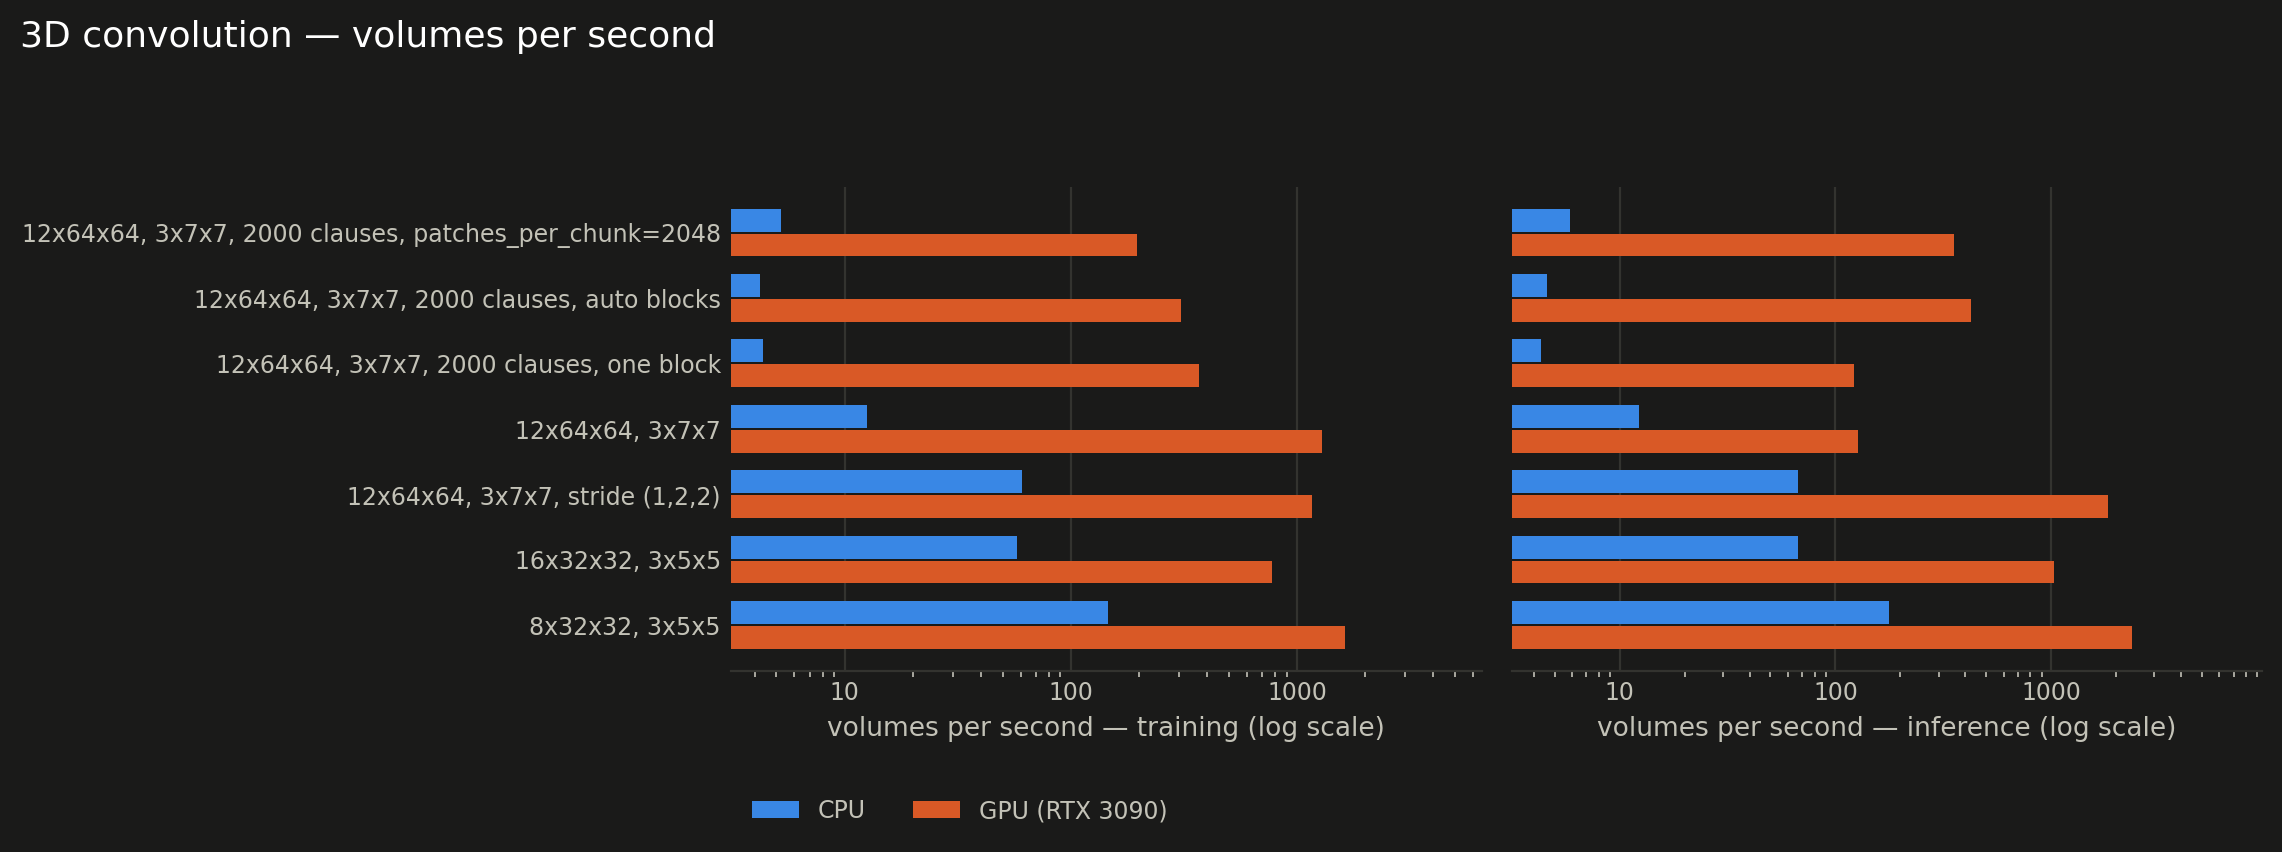
A 3D convolutional machine evaluates every clause at every window position of a volume, so the cost scales with the number of positions P = Pd·Ph·Pw. Throughput is quoted in volumes per second.
- On GPU (RTX 3090), a cardiac-sized 12×64×64 volume with a 3×7×7 window has 33,640 window positions and trains at 1,287.2 volumes/s; an in-plane stride of 2 cuts that to 8,410 positions and runs at 1,168.8 volumes/s (0.9×).
- With 2 000 clauses one such volume no longer fits
max_chunk_elements, so the patch axis is split automatically into blocks of 18,982 positions: peak memory 247 MB at 306.05 volumes/s, against 268 MB at 367.61 volumes/s when it is forced into one block. The output is identical (the OR over patches and the random-patch draw are exact under the split); with fewer clauses, ordinary batch chunking already respects the budget and blocking buys nothing.
3D convolution (1 plane; 2 x 100 clauses, batch 4 — or 10 x 200, batch 2)
| configuration | patches P | patches per block | CPU train vol/s | GPU train vol/s | train speedup | CPU infer vol/s | GPU infer vol/s | infer speedup | GPU peak memory (train) |
|---|---|---|---|---|---|---|---|---|---|
| 8x32x32, 3x5x5 | 4,704 | 4,704 | 146.6 | 1,633.1 | 11× | 176.5 | 2,372.2 | 13× | 60 MB |
| 16x32x32, 3x5x5 | 10,976 | 10,976 | 57.6 | 776.7 | 13× | 66.8 | 1,027.1 | 15× | 142 MB |
| 12x64x64, 3x7x7, stride (1,2,2) | 8,410 | 8,410 | 60.8 | 1,168.8 | 19× | 67.2 | 1,832.5 | 27× | 170 MB |
| 12x64x64, 3x7x7 | 33,640 | 33,640 | 12.6 | 1,287.2 | 102× | 12.3 | 127.5 | 10× | 360 MB |
| 12x64x64, 3x7x7, 2000 clauses, one block | 33,640 | 33,640 | 4.4 | 367.6 | 84× | 4.3 | 121.8 | 28× | 268 MB |
| 12x64x64, 3x7x7, 2000 clauses, auto blocks | 33,640 | 18,982 | 4.2 | 306.0 | 72× | 4.6 | 426.3 | 92× | 247 MB |
| 12x64x64, 3x7x7, 2000 clauses, patches_per_chunk=2048 | 33,640 | 2,048 | 5.2 | 195.8 | 37× | 5.9 | 352.8 | 60× | 266 MB |
End to end: MNIST
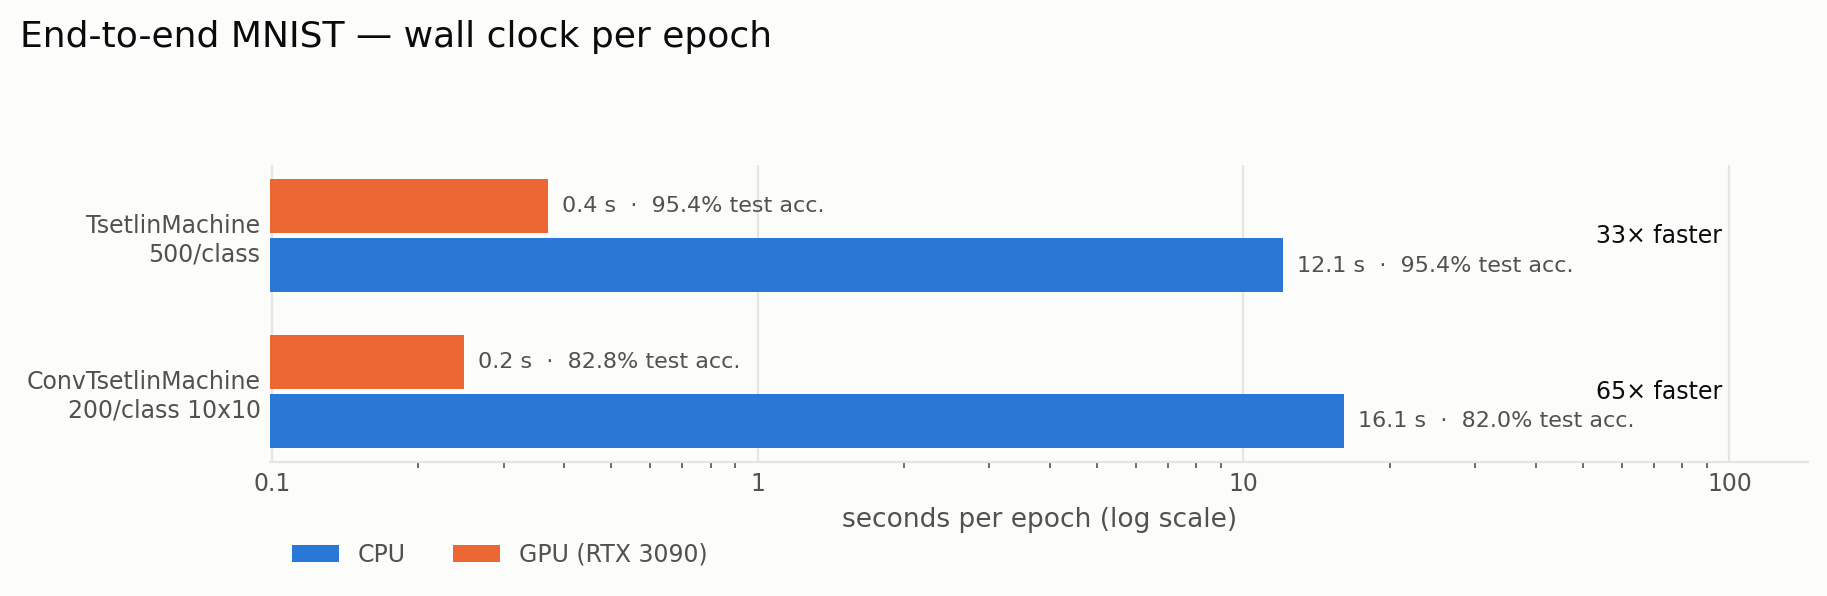
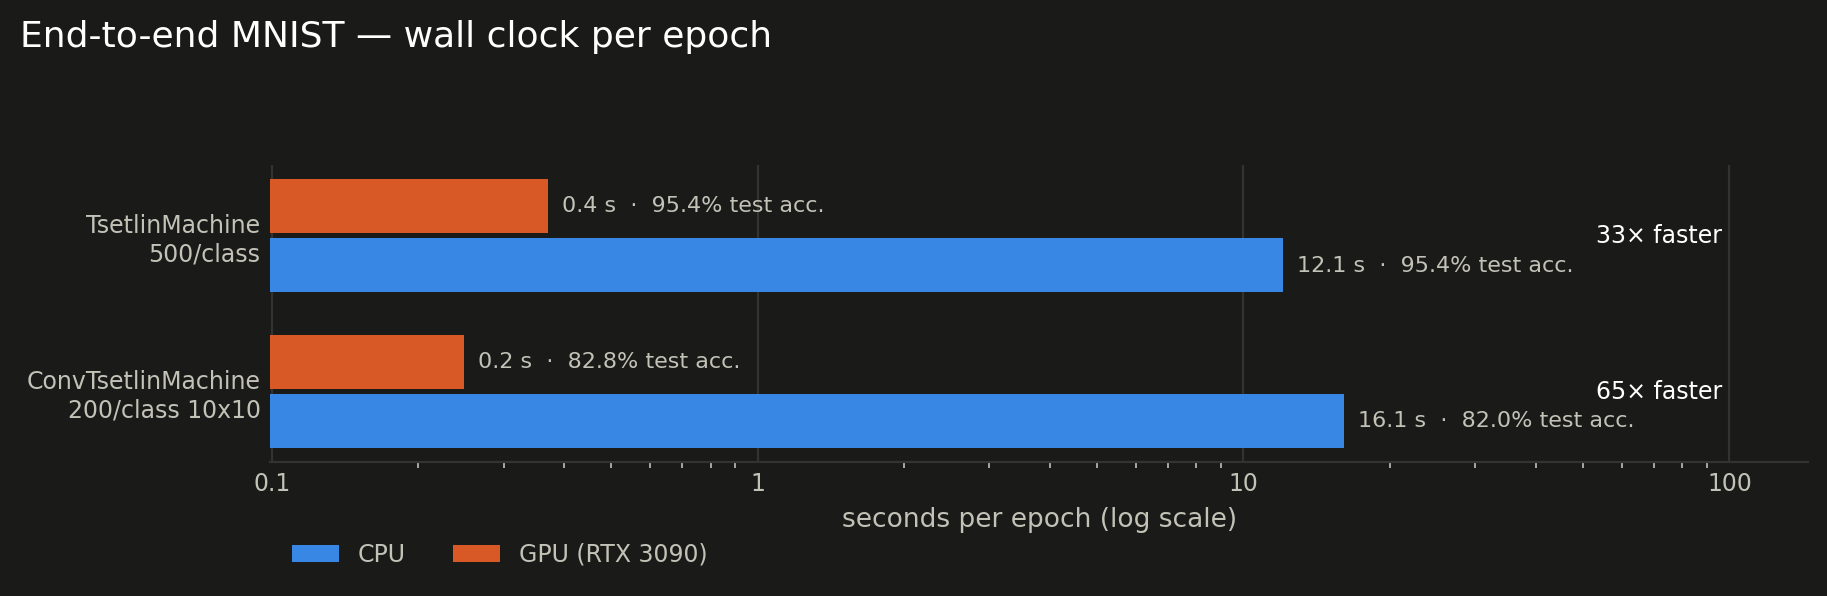
Synthetic micro-benchmarks flatter whichever device wins the micro-benchmark, so here is the whole thing end to end, Trainer.fit included:
- ConvTsetlinMachine 200/class 10x10 — 0.2 s/epoch on the GPU vs 16 s on the CPU (65×), 82.8% test accuracy
- TsetlinMachine 500/class — 0.4 s/epoch on the GPU vs 12 s on the CPU (33×), 95.4% test accuracy
Accuracy matches across devices to within run-to-run noise, as it should — only the wall clock moves. These are short runs at a modest clause budget; see Benchmarks for what longer runs reach.
End-to-end MNIST
| model | device | train examples | epochs | s / epoch | examples/s | test accuracy | GPU peak memory |
|---|---|---|---|---|---|---|---|
| ConvTsetlinMachine 200/class 10x10 | cpu | 10,000 | 1 | 16.12 | 620 | 0.8200 | — |
| ConvTsetlinMachine 200/class 10x10 | cuda:0 | 10,000 | 1 | 0.25 | 40,266 | 0.8280 | 474 MB |
| TsetlinMachine 500/class | cpu | 60,000 | 3 | 12.08 | 4,966 | 0.9541 | — |
| TsetlinMachine 500/class | cuda:0 | 60,000 | 3 | 0.37 | 162,193 | 0.9541 | 236 MB |
Reproducing
./benchmarks/run_benchmarks.sh                  # every suite, cpu + cuda:0
./benchmarks/run_benchmarks.sh --quick          # ~1 min smoke test
./benchmarks/run_benchmarks.sh -s batch models  # a subset
./benchmarks/run_benchmarks.sh --plots-only     # re-render from existing results
The raw records live in benchmarks/results/versions/0.6.0/cpu_vs_gpu.json (one folder per library version); benchmarks/plot_benchmarks.py turns them into the figures above and writes this page.