Benchmark history
The same benchmark suites, run on every torchtsetlin release that has results (0.1.2, 0.1.3, 0.2.0, 0.3.0, 0.3.1, 0.5.0, 0.6.0), side by side. CPU vs GPU explains each suite in detail for the newest version, 0.6.0; this page shows how the numbers moved between versions.
Every version was measured on the same machine, so the columns are directly comparable (run-to-run noise is a few percent):
| version |
measured |
PyTorch |
CPU |
GPU (cuda:0) |
threads |
suites measured |
| 0.1.2 |
2026-09-15 |
2.10.0+cu128 / CUDA 12.8 |
AMD Ryzen 9 3950X 16-Core Processor |
NVIDIA GeForce RTX 3090 |
16 |
all but segmentation, conv3d |
| 0.1.3 |
2026-09-17 |
2.10.0+cu128 / CUDA 12.8 |
AMD Ryzen 9 3950X 16-Core Processor |
NVIDIA GeForce RTX 3090 |
16 |
all but segmentation, conv3d |
| 0.2.0 |
2026-09-23 |
2.10.0+cu128 / CUDA 12.8 |
AMD Ryzen 9 3950X 16-Core Processor |
NVIDIA GeForce RTX 3090 |
16 |
all but conv3d |
| 0.3.0 |
2026-10-12 |
2.10.0+cu128 / CUDA 12.8 |
AMD Ryzen 9 3950X 16-Core Processor |
NVIDIA GeForce RTX 3090 |
16 |
conv3d |
| 0.3.1 |
2026-10-12 |
2.10.0+cu128 / CUDA 12.8 |
AMD Ryzen 9 3950X 16-Core Processor |
NVIDIA GeForce RTX 3090 |
16 |
all |
| 0.5.0 |
2026-10-24 |
2.10.0+cu128 / CUDA 12.8 |
AMD Ryzen 9 3950X 16-Core Processor |
NVIDIA GeForce RTX 3090 |
16 |
all |
| 0.6.0 |
2026-10-29 |
2.10.0+cu128 / CUDA 12.8 |
AMD Ryzen 9 3950X 16-Core Processor |
NVIDIA GeForce RTX 3090 |
16 |
all |
Headline numbers
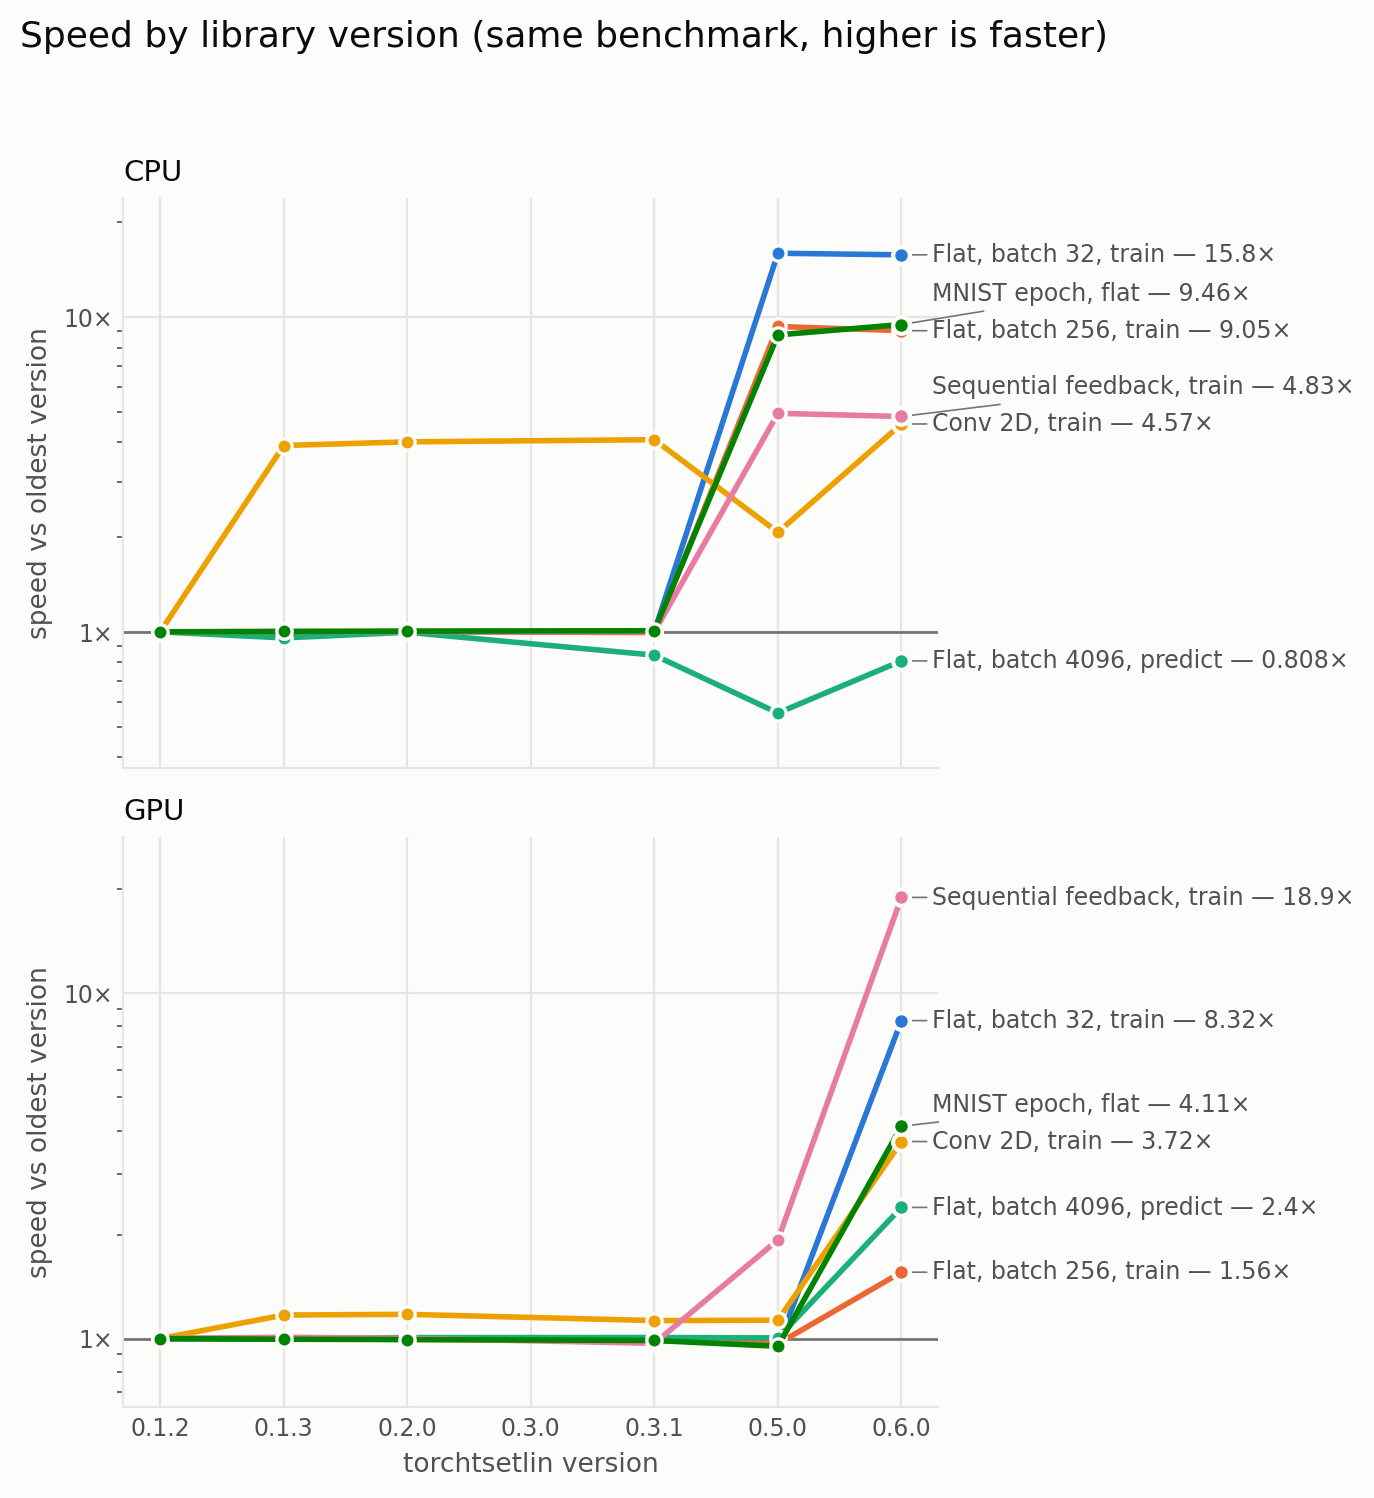
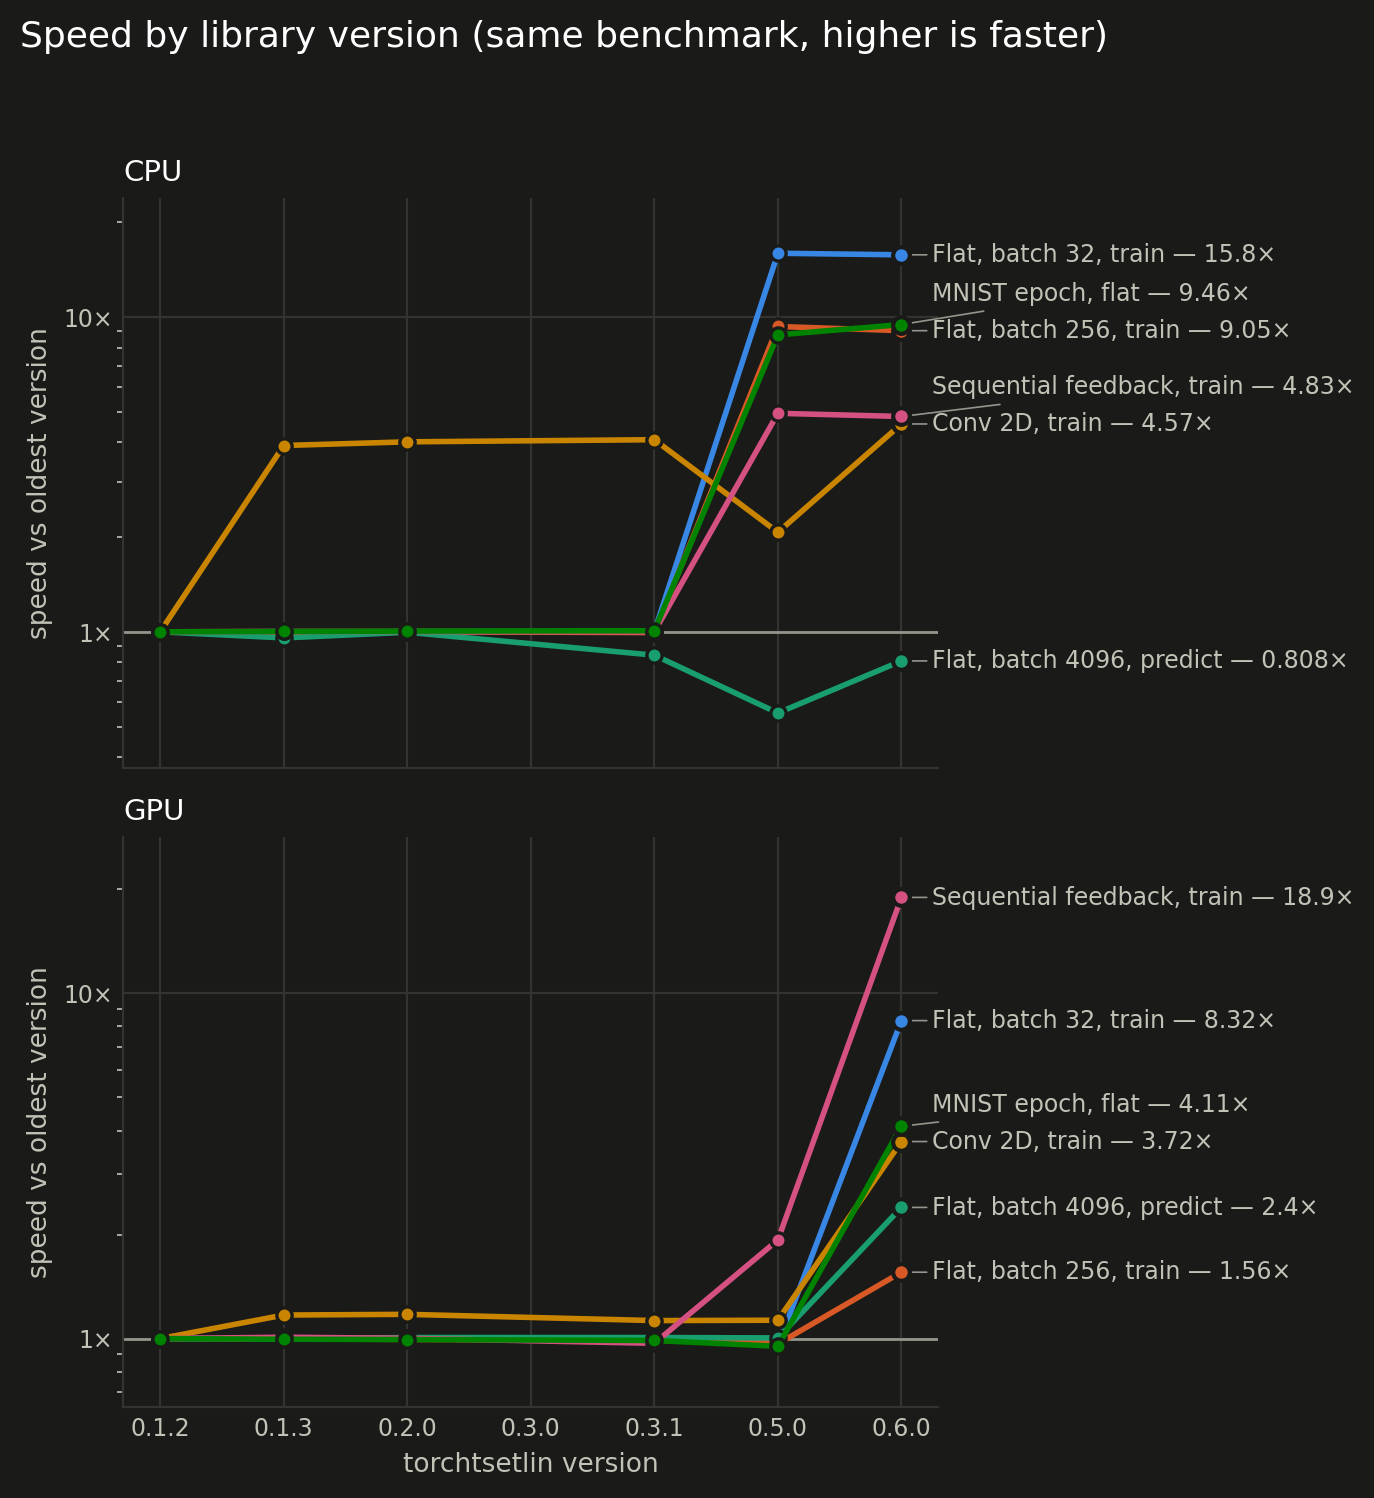
Throughput in examples per second (MNIST: seconds per epoch, lower is better). The last two columns give the speed of the newest version relative to the previous version that measured the configuration and to the oldest one.
| metric |
device |
unit |
0.1.2 |
0.1.3 |
0.2.0 |
0.3.0 |
0.3.1 |
0.5.0 |
0.6.0 |
0.6.0 vs previous |
0.6.0 vs oldest |
| Flat, batch 32, train |
CPU |
ex/s |
118 |
117 |
118 |
— |
118 |
1,875 |
1,853 |
≈ same |
15.8× faster |
| Flat, batch 32, train |
GPU |
ex/s |
13,495 |
13,500 |
13,491 |
— |
13,456 |
12,893 |
112,278 |
8.71× faster |
8.32× faster |
| Flat, batch 256, train |
CPU |
ex/s |
408 |
404 |
408 |
— |
406 |
3,808 |
3,692 |
≈ same |
9.05× faster |
| Flat, batch 256, train |
GPU |
ex/s |
88,908 |
88,771 |
88,409 |
— |
87,869 |
85,839 |
138,358 |
1.61× faster |
1.56× faster |
| Flat, batch 4096, predict |
CPU |
ex/s |
37,217 |
35,596 |
37,102 |
— |
31,372 |
20,554 |
30,085 |
1.46× faster |
1.24× slower |
| Flat, batch 4096, predict |
GPU |
ex/s |
1,051,822 |
1,050,720 |
1,058,967 |
— |
1,059,242 |
1,056,509 |
2,520,419 |
2.39× faster |
2.4× faster |
| Conv 2D, train |
CPU |
ex/s |
137 |
535 |
550 |
— |
559 |
284 |
627 |
2.21× faster |
4.57× faster |
| Conv 2D, train |
GPU |
ex/s |
13,059 |
15,275 |
15,348 |
— |
14,722 |
14,758 |
48,537 |
3.29× faster |
3.72× faster |
| Sequential feedback, train |
CPU |
ex/s |
92.4 |
92.7 |
92.6 |
— |
92.4 |
457 |
446 |
≈ same |
4.83× faster |
| Sequential feedback, train |
GPU |
ex/s |
987 |
996 |
989 |
— |
957 |
1,905 |
18,667 |
9.8× faster |
18.9× faster |
| MNIST epoch, flat |
CPU |
s/epoch |
114.4 |
114.1 |
113.8 |
— |
113.4 |
13 |
12.1 |
1.08× faster |
9.46× faster |
| MNIST epoch, flat |
GPU |
s/epoch |
1.52 |
1.53 |
1.53 |
— |
1.54 |
1.6 |
0.37 |
4.33× faster |
4.11× faster |
Every configuration
One table per suite and phase, with a column per version. A dash means that version did not measure the configuration (the suite did not exist yet, or that release re-ran only some suites — see suites measured above).
Batch size — MNIST scale (784 features, 500 clauses/class)
training (ex/s)
| configuration |
device |
0.1.2 |
0.1.3 |
0.2.0 |
0.3.0 |
0.3.1 |
0.5.0 |
0.6.0 |
0.6.0 vs previous |
| batch 1 |
CPU |
13.9 |
13.2 |
13.6 |
— |
14 |
236 |
228 |
≈ same |
| batch 2 |
CPU |
25.6 |
24.8 |
25.4 |
— |
25.2 |
535 |
533 |
≈ same |
| batch 4 |
CPU |
41.2 |
39.9 |
40.7 |
— |
40.3 |
783 |
783 |
≈ same |
| batch 8 |
CPU |
59.7 |
59 |
59.8 |
— |
60 |
902 |
881 |
≈ same |
| batch 16 |
CPU |
86.6 |
85.2 |
86.3 |
— |
86.8 |
1,330 |
1,285 |
≈ same |
| batch 32 |
CPU |
118 |
117 |
118 |
— |
118 |
1,875 |
1,853 |
≈ same |
| batch 64 |
CPU |
177 |
175 |
178 |
— |
177 |
2,307 |
2,119 |
1.09× slower |
| batch 128 |
CPU |
268 |
265 |
268 |
— |
268 |
2,274 |
2,065 |
1.1× slower |
| batch 256 |
CPU |
408 |
404 |
408 |
— |
406 |
3,808 |
3,692 |
≈ same |
| batch 512 |
CPU |
601 |
594 |
602 |
— |
600 |
1,891 |
4,487 |
2.37× faster |
| batch 1024 |
CPU |
816 |
819 |
822 |
— |
825 |
375 |
5,000 |
13.3× faster |
| batch 2048 |
CPU |
1,574 |
1,554 |
1,561 |
— |
1,562 |
398 |
5,854 |
14.7× faster |
| batch 4096 |
CPU |
3,595 |
3,477 |
3,574 |
— |
3,572 |
413 |
505 |
1.22× faster |
| batch 1 |
GPU |
435 |
434 |
434 |
— |
427 |
415 |
4,042 |
9.73× faster |
| batch 2 |
GPU |
869 |
867 |
866 |
— |
863 |
830 |
8,187 |
9.86× faster |
| batch 4 |
GPU |
1,734 |
1,730 |
1,731 |
— |
1,725 |
1,659 |
16,086 |
9.7× faster |
| batch 8 |
GPU |
3,467 |
3,460 |
3,463 |
— |
3,441 |
3,309 |
31,405 |
9.49× faster |
| batch 16 |
GPU |
6,885 |
6,858 |
6,879 |
— |
6,844 |
6,558 |
59,537 |
9.08× faster |
| batch 32 |
GPU |
13,495 |
13,500 |
13,491 |
— |
13,456 |
12,893 |
112,278 |
8.71× faster |
| batch 64 |
GPU |
26,019 |
26,024 |
25,984 |
— |
25,666 |
24,861 |
200,553 |
8.07× faster |
| batch 128 |
GPU |
49,728 |
49,913 |
49,740 |
— |
49,143 |
47,707 |
299,217 |
6.27× faster |
| batch 256 |
GPU |
88,908 |
88,771 |
88,409 |
— |
87,869 |
85,839 |
138,358 |
1.61× faster |
| batch 512 |
GPU |
133,583 |
133,716 |
133,502 |
— |
133,736 |
131,028 |
214,686 |
1.64× faster |
| batch 1024 |
GPU |
135,876 |
135,232 |
135,426 |
— |
135,655 |
134,214 |
277,166 |
2.07× faster |
| batch 2048 |
GPU |
163,057 |
162,817 |
162,962 |
— |
163,199 |
162,212 |
308,585 |
1.9× faster |
| batch 4096 |
GPU |
219,850 |
219,330 |
219,825 |
— |
220,028 |
217,571 |
248,421 |
1.14× faster |
inference (ex/s)
| configuration |
device |
0.1.2 |
0.1.3 |
0.2.0 |
0.3.0 |
0.3.1 |
0.5.0 |
0.6.0 |
0.6.0 vs previous |
| batch 1 |
CPU |
610 |
625 |
607 |
— |
598 |
625 |
574 |
1.09× slower |
| batch 2 |
CPU |
4,751 |
3,718 |
3,730 |
— |
4,704 |
1,997 |
2,290 |
1.15× faster |
| batch 4 |
CPU |
5,535 |
5,512 |
5,469 |
— |
5,791 |
3,908 |
4,118 |
1.05× faster |
| batch 8 |
CPU |
7,768 |
5,653 |
9,038 |
— |
9,568 |
4,550 |
4,793 |
1.05× faster |
| batch 16 |
CPU |
12,098 |
10,737 |
12,850 |
— |
10,820 |
7,776 |
8,536 |
1.1× faster |
| batch 32 |
CPU |
14,334 |
13,673 |
11,748 |
— |
15,346 |
12,048 |
12,708 |
1.05× faster |
| batch 64 |
CPU |
24,122 |
22,776 |
22,527 |
— |
25,607 |
18,564 |
16,779 |
1.11× slower |
| batch 128 |
CPU |
33,920 |
36,911 |
31,275 |
— |
37,049 |
25,424 |
25,023 |
≈ same |
| batch 256 |
CPU |
43,736 |
43,259 |
40,350 |
— |
44,836 |
33,532 |
31,858 |
≈ same |
| batch 512 |
CPU |
50,373 |
52,117 |
47,781 |
— |
49,559 |
38,146 |
50,911 |
1.33× faster |
| batch 1024 |
CPU |
49,877 |
50,163 |
50,173 |
— |
50,099 |
34,337 |
47,860 |
1.39× faster |
| batch 2048 |
CPU |
42,987 |
40,955 |
42,538 |
— |
38,611 |
22,258 |
30,055 |
1.35× faster |
| batch 4096 |
CPU |
37,217 |
35,596 |
37,102 |
— |
31,372 |
20,554 |
30,085 |
1.46× faster |
| batch 1 |
GPU |
4,338 |
4,360 |
4,319 |
— |
4,196 |
4,514 |
3,906 |
1.16× slower |
| batch 2 |
GPU |
8,423 |
8,470 |
8,359 |
— |
8,182 |
8,725 |
7,680 |
1.14× slower |
| batch 4 |
GPU |
16,796 |
16,919 |
16,732 |
— |
16,432 |
17,552 |
15,358 |
1.14× slower |
| batch 8 |
GPU |
34,203 |
34,724 |
34,308 |
— |
33,415 |
35,782 |
30,683 |
1.17× slower |
| batch 16 |
GPU |
68,290 |
68,949 |
68,535 |
— |
66,762 |
71,604 |
62,631 |
1.14× slower |
| batch 32 |
GPU |
134,143 |
136,963 |
135,560 |
— |
132,358 |
141,574 |
126,117 |
1.12× slower |
| batch 64 |
GPU |
264,766 |
268,156 |
266,289 |
— |
254,309 |
275,440 |
250,169 |
1.1× slower |
| batch 128 |
GPU |
528,702 |
536,762 |
530,798 |
— |
507,533 |
551,375 |
502,813 |
1.1× slower |
| batch 256 |
GPU |
973,520 |
973,896 |
976,002 |
— |
1,036,162 |
1,006,921 |
968,265 |
≈ same |
| batch 512 |
GPU |
978,210 |
982,421 |
980,196 |
— |
982,200 |
983,199 |
1,958,782 |
1.99× faster |
| batch 1024 |
GPU |
997,886 |
1,002,471 |
997,343 |
— |
1,012,965 |
999,139 |
2,410,515 |
2.41× faster |
| batch 2048 |
GPU |
1,040,147 |
1,040,969 |
1,039,721 |
— |
1,045,744 |
1,043,902 |
2,417,111 |
2.32× faster |
| batch 4096 |
GPU |
1,051,822 |
1,050,720 |
1,058,967 |
— |
1,059,242 |
1,056,509 |
2,520,419 |
2.39× faster |
Batch size — Noisy-XOR scale (12 features, 10 clauses/class)
training (ex/s)
| configuration |
device |
0.1.2 |
0.1.3 |
0.2.0 |
0.3.0 |
0.3.1 |
0.5.0 |
0.6.0 |
0.6.0 vs previous |
| batch 1 |
CPU |
2,023 |
2,033 |
2,027 |
— |
2,005 |
914 |
864 |
1.06× slower |
| batch 4 |
CPU |
7,701 |
7,559 |
7,804 |
— |
7,668 |
3,247 |
3,090 |
≈ same |
| batch 16 |
CPU |
28,295 |
26,336 |
28,775 |
— |
27,988 |
12,563 |
11,979 |
≈ same |
| batch 64 |
CPU |
102,355 |
101,788 |
104,052 |
— |
101,867 |
47,768 |
45,845 |
≈ same |
| batch 256 |
CPU |
340,396 |
310,815 |
348,051 |
— |
342,488 |
137,059 |
133,553 |
≈ same |
| batch 1024 |
CPU |
815,743 |
811,259 |
837,164 |
— |
814,544 |
322,342 |
308,262 |
≈ same |
| batch 1 |
GPU |
867 |
868 |
876 |
— |
856 |
842 |
4,403 |
5.23× faster |
| batch 4 |
GPU |
3,458 |
3,472 |
3,562 |
— |
3,425 |
3,374 |
17,714 |
5.25× faster |
| batch 16 |
GPU |
13,992 |
13,758 |
14,127 |
— |
13,306 |
13,471 |
71,039 |
5.27× faster |
| batch 64 |
GPU |
56,475 |
55,743 |
55,547 |
— |
53,237 |
53,734 |
285,206 |
5.31× faster |
| batch 256 |
GPU |
225,817 |
223,279 |
221,235 |
— |
212,026 |
214,356 |
203,689 |
≈ same |
| batch 1024 |
GPU |
900,355 |
889,912 |
885,126 |
— |
844,508 |
856,844 |
822,790 |
≈ same |
inference (ex/s)
| configuration |
device |
0.1.2 |
0.1.3 |
0.2.0 |
0.3.0 |
0.3.1 |
0.5.0 |
0.6.0 |
0.6.0 vs previous |
| batch 1 |
CPU |
9,216 |
9,256 |
9,078 |
— |
9,060 |
9,118 |
8,572 |
1.06× slower |
| batch 4 |
CPU |
33,403 |
31,244 |
33,581 |
— |
32,932 |
31,705 |
29,995 |
1.06× slower |
| batch 16 |
CPU |
129,223 |
120,168 |
129,374 |
— |
127,638 |
121,723 |
115,284 |
1.06× slower |
| batch 64 |
CPU |
492,748 |
495,099 |
498,255 |
— |
485,903 |
464,140 |
440,671 |
1.05× slower |
| batch 256 |
CPU |
1,665,862 |
1,675,155 |
1,701,739 |
— |
1,661,668 |
1,553,292 |
1,448,447 |
1.07× slower |
| batch 1024 |
CPU |
4,297,605 |
4,208,516 |
4,404,556 |
— |
4,119,959 |
3,751,614 |
4,124,239 |
1.1× faster |
| batch 1 |
GPU |
4,327 |
4,357 |
4,344 |
— |
4,243 |
4,490 |
3,998 |
1.12× slower |
| batch 4 |
GPU |
17,434 |
17,146 |
17,316 |
— |
16,843 |
17,955 |
15,801 |
1.14× slower |
| batch 16 |
GPU |
69,016 |
68,442 |
68,716 |
— |
66,415 |
71,267 |
62,742 |
1.14× slower |
| batch 64 |
GPU |
275,926 |
272,341 |
272,231 |
— |
261,939 |
282,078 |
251,805 |
1.12× slower |
| batch 256 |
GPU |
1,099,445 |
1,095,895 |
1,089,140 |
— |
1,043,140 |
1,128,060 |
1,007,928 |
1.12× slower |
| batch 1024 |
GPU |
4,410,996 |
4,417,422 |
4,344,685 |
— |
4,189,408 |
4,507,826 |
4,026,418 |
1.12× slower |
Clause budget (784 features, batch 256)
training (ex/s)
| configuration |
device |
0.1.2 |
0.1.3 |
0.2.0 |
0.3.0 |
0.3.1 |
0.5.0 |
0.6.0 |
0.6.0 vs previous |
| clauses/class 50 |
CPU |
4,305 |
4,285 |
4,297 |
— |
4,317 |
5,590 |
4,961 |
1.13× slower |
| clauses/class 100 |
CPU |
2,126 |
2,100 |
2,130 |
— |
2,171 |
12,312 |
11,918 |
≈ same |
| clauses/class 250 |
CPU |
839 |
843 |
850 |
— |
843 |
5,928 |
5,290 |
1.12× slower |
| clauses/class 500 |
CPU |
408 |
405 |
407 |
— |
411 |
3,832 |
3,560 |
1.08× slower |
| clauses/class 1000 |
CPU |
195 |
193 |
195 |
— |
196 |
1,736 |
1,474 |
1.18× slower |
| clauses/class 2000 |
CPU |
96.2 |
95.3 |
96.4 |
— |
96.5 |
828 |
784 |
1.06× slower |
| clauses/class 4000 |
CPU |
48.2 |
47.8 |
48.4 |
— |
48.3 |
558 |
514 |
1.09× slower |
| clauses/class 50 |
GPU |
221,413 |
213,338 |
222,144 |
— |
214,398 |
209,061 |
192,140 |
1.09× slower |
| clauses/class 100 |
GPU |
197,442 |
191,437 |
196,529 |
— |
193,714 |
189,082 |
186,057 |
≈ same |
| clauses/class 250 |
GPU |
132,825 |
132,851 |
132,949 |
— |
131,802 |
126,883 |
167,860 |
1.32× faster |
| clauses/class 500 |
GPU |
89,236 |
88,263 |
89,182 |
— |
88,661 |
84,393 |
141,289 |
1.67× faster |
| clauses/class 1000 |
GPU |
50,177 |
50,015 |
50,129 |
— |
50,089 |
48,920 |
91,372 |
1.87× faster |
| clauses/class 2000 |
GPU |
25,934 |
25,864 |
25,877 |
— |
25,917 |
25,678 |
47,474 |
1.85× faster |
| clauses/class 4000 |
GPU |
13,155 |
13,131 |
13,143 |
— |
13,162 |
13,099 |
24,116 |
1.84× faster |
inference (ex/s)
| configuration |
device |
0.1.2 |
0.1.3 |
0.2.0 |
0.3.0 |
0.3.1 |
0.5.0 |
0.6.0 |
0.6.0 vs previous |
| clauses/class 50 |
CPU |
274,054 |
269,443 |
272,321 |
— |
270,425 |
238,356 |
248,098 |
≈ same |
| clauses/class 100 |
CPU |
196,041 |
185,632 |
200,299 |
— |
198,824 |
157,397 |
151,742 |
≈ same |
| clauses/class 250 |
CPU |
91,942 |
98,730 |
100,482 |
— |
101,325 |
68,018 |
63,210 |
1.08× slower |
| clauses/class 500 |
CPU |
42,105 |
42,758 |
43,554 |
— |
45,514 |
33,363 |
32,815 |
≈ same |
| clauses/class 1000 |
CPU |
17,096 |
16,253 |
16,104 |
— |
16,232 |
14,576 |
13,330 |
1.09× slower |
| clauses/class 2000 |
CPU |
5,270 |
4,833 |
5,232 |
— |
5,185 |
5,992 |
5,661 |
1.06× slower |
| clauses/class 4000 |
CPU |
2,163 |
2,263 |
2,364 |
— |
2,176 |
2,024 |
1,999 |
≈ same |
| clauses/class 50 |
GPU |
1,070,851 |
1,038,778 |
1,060,763 |
— |
1,035,221 |
1,108,202 |
979,219 |
1.13× slower |
| clauses/class 100 |
GPU |
1,061,270 |
1,062,227 |
1,059,681 |
— |
1,033,967 |
1,105,896 |
1,011,026 |
1.09× slower |
| clauses/class 250 |
GPU |
1,065,604 |
1,068,318 |
1,064,366 |
— |
1,041,135 |
1,104,184 |
1,004,436 |
1.1× slower |
| clauses/class 500 |
GPU |
1,008,762 |
997,750 |
1,008,095 |
— |
1,002,631 |
1,014,205 |
985,867 |
≈ same |
| clauses/class 1000 |
GPU |
534,902 |
534,612 |
532,965 |
— |
536,367 |
535,050 |
1,000,287 |
1.87× faster |
| clauses/class 2000 |
GPU |
260,191 |
259,559 |
259,517 |
— |
260,242 |
259,310 |
629,095 |
2.43× faster |
| clauses/class 4000 |
GPU |
132,146 |
131,950 |
132,215 |
— |
132,661 |
132,470 |
260,728 |
1.97× faster |
Feature count (500 clauses/class, batch 256)
training (ex/s)
| configuration |
device |
0.1.2 |
0.1.3 |
0.2.0 |
0.3.0 |
0.3.1 |
0.5.0 |
0.6.0 |
0.6.0 vs previous |
| features 128 |
CPU |
3,035 |
3,034 |
3,012 |
— |
3,035 |
9,416 |
9,768 |
≈ same |
| features 256 |
CPU |
1,380 |
1,365 |
1,372 |
— |
1,380 |
8,448 |
9,587 |
1.13× faster |
| features 512 |
CPU |
624 |
616 |
618 |
— |
624 |
5,161 |
4,613 |
1.12× slower |
| features 1024 |
CPU |
303 |
299 |
301 |
— |
304 |
3,239 |
2,897 |
1.12× slower |
| features 2048 |
CPU |
151 |
150 |
151 |
— |
152 |
1,479 |
1,349 |
1.1× slower |
| features 4096 |
CPU |
76 |
75.6 |
76.1 |
— |
76.3 |
866 |
842 |
≈ same |
| features 8192 |
CPU |
37.5 |
38 |
37.4 |
— |
37.3 |
671 |
603 |
1.11× slower |
| features 128 |
GPU |
214,310 |
213,641 |
212,644 |
— |
210,639 |
204,042 |
187,734 |
1.09× slower |
| features 256 |
GPU |
165,657 |
165,840 |
164,964 |
— |
164,441 |
158,938 |
178,397 |
1.12× faster |
| features 512 |
GPU |
116,357 |
116,342 |
116,100 |
— |
115,630 |
111,969 |
158,266 |
1.41× faster |
| features 1024 |
GPU |
73,877 |
73,619 |
73,793 |
— |
73,440 |
71,526 |
131,572 |
1.84× faster |
| features 2048 |
GPU |
40,059 |
39,943 |
40,115 |
— |
39,913 |
39,644 |
77,025 |
1.94× faster |
| features 4096 |
GPU |
21,300 |
21,287 |
21,289 |
— |
21,310 |
21,319 |
42,651 |
2× faster |
| features 8192 |
GPU |
10,728 |
10,712 |
10,725 |
— |
10,721 |
10,835 |
21,766 |
2.01× faster |
inference (ex/s)
| configuration |
device |
0.1.2 |
0.1.3 |
0.2.0 |
0.3.0 |
0.3.1 |
0.5.0 |
0.6.0 |
0.6.0 vs previous |
| features 128 |
CPU |
171,523 |
174,021 |
175,836 |
— |
185,183 |
67,402 |
89,701 |
1.33× faster |
| features 256 |
CPU |
108,372 |
107,345 |
111,181 |
— |
110,134 |
72,175 |
52,506 |
1.37× slower |
| features 512 |
CPU |
57,083 |
57,129 |
62,623 |
— |
55,644 |
41,170 |
36,591 |
1.13× slower |
| features 1024 |
CPU |
30,671 |
32,955 |
33,448 |
— |
33,927 |
23,943 |
24,392 |
≈ same |
| features 2048 |
CPU |
18,185 |
17,984 |
18,281 |
— |
18,598 |
13,074 |
13,695 |
≈ same |
| features 4096 |
CPU |
8,053 |
9,984 |
8,680 |
— |
8,715 |
7,716 |
7,355 |
≈ same |
| features 8192 |
CPU |
1,489 |
3,683 |
1,509 |
— |
1,565 |
3,880 |
3,787 |
≈ same |
| features 128 |
GPU |
1,096,982 |
1,099,465 |
1,093,778 |
— |
1,076,020 |
1,124,166 |
960,951 |
1.17× slower |
| features 256 |
GPU |
1,080,471 |
1,088,210 |
1,081,265 |
— |
1,059,144 |
1,119,424 |
997,185 |
1.12× slower |
| features 512 |
GPU |
1,084,256 |
1,086,528 |
1,082,033 |
— |
1,065,061 |
1,118,099 |
981,522 |
1.14× slower |
| features 1024 |
GPU |
793,128 |
797,536 |
789,768 |
— |
806,665 |
803,508 |
977,050 |
1.22× faster |
| features 2048 |
GPU |
413,833 |
410,650 |
414,439 |
— |
411,893 |
416,444 |
973,727 |
2.34× faster |
| features 4096 |
GPU |
217,610 |
217,627 |
216,221 |
— |
217,643 |
218,238 |
605,203 |
2.77× faster |
| features 8192 |
GPU |
116,549 |
116,425 |
115,659 |
— |
116,496 |
116,073 |
330,395 |
2.85× faster |
Model zoo (784 features, batch 128)
training (ex/s)
| configuration |
device |
0.1.2 |
0.1.3 |
0.2.0 |
0.3.0 |
0.3.1 |
0.5.0 |
0.6.0 |
0.6.0 vs previous |
| TsetlinMachine |
CPU |
268 |
269 |
268 |
— |
269 |
2,300 |
2,251 |
≈ same |
| TsetlinMachine (weighted) |
CPU |
268 |
267 |
268 |
— |
268 |
3,126 |
2,608 |
1.2× slower |
| CoalescedTsetlinMachine |
CPU |
178 |
177 |
179 |
— |
178 |
138 |
1,823 |
13.2× faster |
| RegressionTsetlinMachine |
CPU |
214 |
213 |
214 |
— |
215 |
2,687 |
3,047 |
1.13× faster |
| ConvTsetlinMachine |
CPU |
137 |
535 |
550 |
— |
559 |
284 |
627 |
2.21× faster |
| ConvCoalescedTsetlinMachine |
CPU |
132 |
389 |
407 |
— |
393 |
230 |
497 |
2.16× faster |
| TsetlinMachine |
GPU |
49,638 |
49,794 |
49,323 |
— |
48,433 |
47,317 |
275,696 |
5.83× faster |
| TsetlinMachine (weighted) |
GPU |
49,475 |
49,534 |
49,016 |
— |
48,228 |
46,895 |
292,007 |
6.23× faster |
| CoalescedTsetlinMachine |
GPU |
43,579 |
43,563 |
43,810 |
— |
42,684 |
41,680 |
197,189 |
4.73× faster |
| RegressionTsetlinMachine |
GPU |
56,822 |
56,950 |
56,923 |
— |
56,935 |
61,418 |
312,436 |
5.09× faster |
| ConvTsetlinMachine |
GPU |
13,059 |
15,275 |
15,348 |
— |
14,722 |
14,758 |
48,537 |
3.29× faster |
| ConvCoalescedTsetlinMachine |
GPU |
13,137 |
15,356 |
15,167 |
— |
15,116 |
14,980 |
47,276 |
3.16× faster |
inference (ex/s)
| configuration |
device |
0.1.2 |
0.1.3 |
0.2.0 |
0.3.0 |
0.3.1 |
0.5.0 |
0.6.0 |
0.6.0 vs previous |
| TsetlinMachine |
CPU |
30,719 |
37,801 |
38,947 |
— |
31,087 |
25,871 |
19,614 |
1.32× slower |
| TsetlinMachine (weighted) |
CPU |
32,227 |
33,830 |
38,871 |
— |
32,101 |
23,241 |
23,596 |
≈ same |
| CoalescedTsetlinMachine |
CPU |
34,222 |
34,536 |
33,236 |
— |
34,131 |
22,909 |
23,299 |
≈ same |
| RegressionTsetlinMachine |
CPU |
44,567 |
39,960 |
37,798 |
— |
42,894 |
24,957 |
27,998 |
1.12× faster |
| ConvTsetlinMachine |
CPU |
140 |
676 |
691 |
— |
710 |
279 |
616 |
2.21× faster |
| ConvCoalescedTsetlinMachine |
CPU |
138 |
658 |
683 |
— |
702 |
274 |
628 |
2.3× faster |
| TsetlinMachine |
GPU |
526,882 |
529,243 |
514,720 |
— |
490,091 |
533,196 |
500,053 |
1.07× slower |
| TsetlinMachine (weighted) |
GPU |
491,498 |
482,612 |
496,297 |
— |
451,039 |
492,731 |
462,666 |
1.06× slower |
| CoalescedTsetlinMachine |
GPU |
526,083 |
527,674 |
536,311 |
— |
493,050 |
535,160 |
501,733 |
1.07× slower |
| RegressionTsetlinMachine |
GPU |
577,994 |
562,748 |
589,188 |
— |
541,666 |
558,955 |
527,448 |
1.06× slower |
| ConvTsetlinMachine |
GPU |
17,942 |
24,805 |
24,778 |
— |
24,822 |
24,738 |
56,769 |
2.29× faster |
| ConvCoalescedTsetlinMachine |
GPU |
17,826 |
24,565 |
24,611 |
— |
24,627 |
24,542 |
56,652 |
2.31× faster |
Update cost breakdown (5 000 clauses, 784 features, batch 256)
whole update (ms)
| configuration |
device |
0.1.2 |
0.1.3 |
0.2.0 |
0.3.0 |
0.3.1 |
0.5.0 |
0.6.0 |
0.6.0 vs previous |
| update_total |
CPU |
623.4 |
625.3 |
626.8 |
— |
624.1 |
54.6 |
57.2 |
≈ same |
| update_total |
GPU |
2.8 |
2.79 |
2.8 |
— |
2.85 |
2.92 |
1.88 |
1.55× faster |
update stages (ms)
| configuration |
device |
0.1.2 |
0.1.3 |
0.2.0 |
0.3.0 |
0.3.1 |
0.5.0 |
0.6.0 |
0.6.0 vs previous |
| encode |
CPU |
0.0775 |
0.062 |
0.0617 |
— |
0.0801 |
0.0639 |
0.0746 |
1.17× slower |
| evaluate |
CPU |
5.18 |
5.35 |
5.52 |
— |
5.33 |
7.42 |
7.51 |
≈ same |
| votes+select |
CPU |
7.44 |
7.52 |
7.39 |
— |
8.03 |
7.65 |
9.06 |
1.18× slower |
| feedback_counts |
CPU |
14.2 |
14.8 |
14.7 |
— |
14.2 |
15.2 |
15 |
≈ same |
| accumulator_alloc |
CPU |
15.5 |
16.4 |
16.4 |
— |
15.7 |
3.84 |
3.8 |
≈ same |
| coerce_targets |
CPU |
0.0142 |
0.0145 |
0.0146 |
— |
0.0147 |
0.0142 |
0.00891 |
1.59× faster |
| refresh_include |
CPU |
14.5 |
15.5 |
15.3 |
— |
14.5 |
14.3 |
15.3 |
1.07× slower |
| commit |
CPU |
589.8 |
591.7 |
591.9 |
— |
589.0 |
27.3 |
27.9 |
≈ same |
| apply_feedback |
CPU |
575.3 |
576.2 |
576.7 |
— |
574.5 |
13 |
12.6 |
≈ same |
| torch.binomial (C x 2F) |
CPU |
266.8 |
266.7 |
265.8 |
— |
266.5 |
267.0 |
266.6 |
≈ same |
| encode |
GPU |
0.0347 |
0.0343 |
0.0349 |
— |
0.0371 |
0.0357 |
0.0379 |
1.06× slower |
| evaluate |
GPU |
0.207 |
0.207 |
0.208 |
— |
0.208 |
0.208 |
0.108 |
1.92× faster |
| votes+select |
GPU |
0.474 |
0.471 |
0.477 |
— |
0.501 |
0.482 |
0.436 |
1.11× faster |
| feedback_counts |
GPU |
0.66 |
0.668 |
0.675 |
— |
0.668 |
0.67 |
0.675 |
≈ same |
| accumulator_alloc |
GPU |
0.113 |
0.113 |
0.113 |
— |
0.114 |
0.115 |
0.117 |
≈ same |
| coerce_targets |
GPU |
0.0641 |
0.0629 |
0.0632 |
— |
0.0687 |
0.0653 |
0.0522 |
1.25× faster |
| refresh_include |
GPU |
0.266 |
0.265 |
0.264 |
— |
0.267 |
0.24 |
0.227 |
1.06× faster |
| commit |
GPU |
1.5 |
1.5 |
1.51 |
— |
1.55 |
1.56 |
0.803 |
1.94× faster |
| apply_feedback |
GPU |
1.17 |
1.17 |
1.18 |
— |
1.21 |
1.25 |
0.525 |
2.39× faster |
| torch.binomial (C x 2F) |
GPU |
0.216 |
0.216 |
0.217 |
— |
0.216 |
0.216 |
0.209 |
≈ same |
CPU thread scaling (5 000 clauses, 784 features, batch 256)
training (ex/s)
| configuration |
device |
0.1.2 |
0.1.3 |
0.2.0 |
0.3.0 |
0.3.1 |
0.5.0 |
0.6.0 |
0.6.0 vs previous |
| threads 1 |
CPU |
288 |
287 |
288 |
— |
288 |
750 |
720 |
≈ same |
| threads 2 |
CPU |
342 |
341 |
342 |
— |
341 |
1,572 |
1,528 |
≈ same |
| threads 4 |
CPU |
369 |
368 |
369 |
— |
370 |
2,103 |
2,015 |
≈ same |
| threads 8 |
CPU |
397 |
395 |
395 |
— |
397 |
3,889 |
3,860 |
≈ same |
| threads 16 |
CPU |
408 |
408 |
407 |
— |
409 |
4,827 |
4,136 |
1.17× slower |
| threads 32 |
CPU |
390 |
381 |
396 |
— |
376 |
1,778 |
379 |
4.7× slower |
| threads 16 |
GPU |
87,767 |
89,564 |
88,920 |
— |
87,724 |
85,796 |
140,198 |
1.63× faster |
inference (ex/s)
| configuration |
device |
0.1.2 |
0.1.3 |
0.2.0 |
0.3.0 |
0.3.1 |
0.5.0 |
0.6.0 |
0.6.0 vs previous |
| threads 1 |
CPU |
4,463 |
4,453 |
4,452 |
— |
4,422 |
4,726 |
4,629 |
≈ same |
| threads 2 |
CPU |
7,547 |
7,545 |
7,537 |
— |
7,608 |
9,154 |
9,072 |
≈ same |
| threads 4 |
CPU |
12,849 |
12,787 |
12,881 |
— |
13,011 |
11,366 |
10,974 |
≈ same |
| threads 8 |
CPU |
28,969 |
29,031 |
26,670 |
— |
28,373 |
24,811 |
23,464 |
1.06× slower |
| threads 16 |
CPU |
43,916 |
48,381 |
42,968 |
— |
46,742 |
33,126 |
29,778 |
1.11× slower |
| threads 32 |
CPU |
42,980 |
38,418 |
39,286 |
— |
47,690 |
29,404 |
23,923 |
1.23× slower |
| threads 16 |
GPU |
1,018,752 |
1,011,646 |
1,016,269 |
— |
1,028,754 |
1,025,637 |
989,298 |
≈ same |
Batched vs sequential feedback
training (ex/s)
| configuration |
device |
0.1.2 |
0.1.3 |
0.2.0 |
0.3.0 |
0.3.1 |
0.5.0 |
0.6.0 |
0.6.0 vs previous |
| xor/batch, batch 1 |
CPU |
2,009 |
2,027 |
2,012 |
— |
1,982 |
910 |
832 |
1.09× slower |
| xor/batch, batch 32 |
CPU |
51,315 |
54,892 |
52,113 |
— |
53,831 |
24,568 |
22,225 |
1.11× slower |
| xor/batch, batch 256 |
CPU |
348,382 |
340,739 |
329,822 |
— |
339,139 |
133,759 |
119,070 |
1.12× slower |
| xor/sequential, batch 1 |
CPU |
2,054 |
2,050 |
1,979 |
— |
2,007 |
1,010 |
925 |
1.09× slower |
| xor/sequential, batch 32 |
CPU |
2,308 |
2,279 |
2,269 |
— |
2,234 |
893 |
830 |
1.08× slower |
| mnist-1k/batch, batch 1 |
CPU |
111 |
110 |
110 |
— |
109 |
464 |
439 |
1.06× slower |
| mnist-1k/batch, batch 32 |
CPU |
675 |
679 |
675 |
— |
678 |
3,068 |
2,878 |
1.07× slower |
| mnist-1k/batch, batch 256 |
CPU |
2,135 |
2,134 |
2,167 |
— |
2,171 |
17,457 |
16,428 |
1.06× slower |
| mnist-1k/sequential, batch 1 |
CPU |
113 |
113 |
112 |
— |
113 |
415 |
370 |
1.12× slower |
| mnist-1k/sequential, batch 32 |
CPU |
92.4 |
92.7 |
92.6 |
— |
92.4 |
457 |
446 |
≈ same |
| xor/batch, batch 1 |
GPU |
884 |
879 |
881 |
— |
869 |
840 |
4,364 |
5.19× faster |
| xor/batch, batch 32 |
GPU |
28,188 |
28,110 |
28,080 |
— |
27,736 |
26,698 |
141,475 |
5.3× faster |
| xor/batch, batch 256 |
GPU |
225,090 |
224,438 |
224,628 |
— |
221,460 |
213,251 |
207,292 |
≈ same |
| xor/sequential, batch 1 |
GPU |
887 |
886 |
887 |
— |
873 |
374 |
358 |
≈ same |
| xor/sequential, batch 32 |
GPU |
1,001 |
999 |
998 |
— |
965 |
369 |
355 |
≈ same |
| mnist-1k/batch, batch 1 |
GPU |
855 |
853 |
855 |
— |
829 |
826 |
4,377 |
5.3× faster |
| mnist-1k/batch, batch 32 |
GPU |
26,747 |
26,650 |
26,662 |
— |
25,939 |
25,811 |
141,337 |
5.48× faster |
| mnist-1k/batch, batch 256 |
GPU |
197,029 |
197,121 |
197,313 |
— |
192,806 |
187,961 |
183,495 |
≈ same |
| mnist-1k/sequential, batch 1 |
GPU |
857 |
860 |
863 |
— |
831 |
1,476 |
1,456 |
≈ same |
| mnist-1k/sequential, batch 32 |
GPU |
987 |
996 |
989 |
— |
957 |
1,905 |
18,667 |
9.8× faster |
Host- vs device-resident data (training, 784 features, 500 clauses/class)
training (ex/s)
| configuration |
device |
0.1.2 |
0.1.3 |
0.2.0 |
0.3.0 |
0.3.1 |
0.5.0 |
0.6.0 |
0.6.0 vs previous |
| batch 32, on device |
CPU |
118 |
118 |
117 |
— |
119 |
1,630 |
1,420 |
1.15× slower |
| batch 32, host → device |
CPU |
118 |
118 |
118 |
— |
118 |
1,830 |
1,366 |
1.34× slower |
| batch 256, on device |
CPU |
403 |
406 |
406 |
— |
407 |
3,973 |
3,538 |
1.12× slower |
| batch 256, host → device |
CPU |
406 |
409 |
408 |
— |
410 |
4,128 |
3,570 |
1.16× slower |
| batch 2048, on device |
CPU |
1,504 |
1,555 |
1,544 |
— |
1,530 |
398 |
5,268 |
13.2× faster |
| batch 2048, host → device |
CPU |
1,509 |
1,557 |
1,553 |
— |
1,550 |
397 |
5,719 |
14.4× faster |
| batch 32, on device |
GPU |
13,523 |
13,564 |
13,496 |
— |
13,358 |
12,776 |
101,124 |
7.92× faster |
| batch 32, host → device |
GPU |
13,520 |
13,545 |
13,454 |
— |
13,379 |
12,746 |
104,502 |
8.2× faster |
| batch 256, on device |
GPU |
89,130 |
89,488 |
89,091 |
— |
88,270 |
85,294 |
136,039 |
1.59× faster |
| batch 256, host → device |
GPU |
87,927 |
88,474 |
88,214 |
— |
87,406 |
84,361 |
135,599 |
1.61× faster |
| batch 2048, on device |
GPU |
164,500 |
164,211 |
163,871 |
— |
164,467 |
162,825 |
305,019 |
1.87× faster |
| batch 2048, host → device |
GPU |
161,924 |
162,370 |
162,128 |
— |
162,524 |
160,027 |
301,221 |
1.88× faster |
Dense segmentation (4 planes, 4 classes, batch 8 images)
training (ex/s)
| configuration |
device |
0.1.2 |
0.1.3 |
0.2.0 |
0.3.0 |
0.3.1 |
0.5.0 |
0.6.0 |
0.6.0 vs previous |
| dense 3x3 32px |
CPU |
— |
— |
34.2 |
— |
34.1 |
20.4 |
20 |
≈ same |
| dense 5x5 32px |
CPU |
— |
— |
15.9 |
— |
15.5 |
11.9 |
12.1 |
≈ same |
| dense 3x3 64px |
CPU |
— |
— |
8.62 |
— |
8.69 |
5.2 |
5.08 |
≈ same |
| dense 3x3 32px + position |
CPU |
— |
— |
26.9 |
— |
26.9 |
16.7 |
16.9 |
≈ same |
| dense 3x3 32px 400 clauses |
CPU |
— |
— |
11.5 |
— |
11.6 |
9.2 |
9.93 |
1.08× faster |
| dense 3x3 32px ppc=32 |
CPU |
— |
— |
15 |
— |
15.1 |
9.09 |
9.11 |
≈ same |
| dense 3x3 32px ppc=512 |
CPU |
— |
— |
70.6 |
— |
70.5 |
41.7 |
44.8 |
1.07× faster |
| dense 3x3 32px ppc=None |
CPU |
— |
— |
149 |
— |
144 |
43.1 |
42.4 |
≈ same |
| dense 3x3 32px |
GPU |
— |
— |
118 |
— |
115 |
111 |
105 |
1.06× slower |
| dense 5x5 32px |
GPU |
— |
— |
119 |
— |
115 |
112 |
107 |
≈ same |
| dense 3x3 64px |
GPU |
— |
— |
29.8 |
— |
27.7 |
28 |
27.1 |
≈ same |
| dense 3x3 32px + position |
GPU |
— |
— |
119 |
— |
111 |
114 |
109 |
1.05× slower |
| dense 3x3 32px 400 clauses |
GPU |
— |
— |
119 |
— |
110 |
114 |
108 |
1.05× slower |
| dense 3x3 32px ppc=32 |
GPU |
— |
— |
29.7 |
— |
29 |
28.8 |
27.2 |
1.06× slower |
| dense 3x3 32px ppc=512 |
GPU |
— |
— |
456 |
— |
429 |
446 |
420 |
1.06× slower |
| dense 3x3 32px ppc=None |
GPU |
— |
— |
5,694 |
— |
5,656 |
5,589 |
5,243 |
1.07× slower |
inference (ex/s)
| configuration |
device |
0.1.2 |
0.1.3 |
0.2.0 |
0.3.0 |
0.3.1 |
0.5.0 |
0.6.0 |
0.6.0 vs previous |
| dense 3x3 32px |
CPU |
— |
— |
1,141 |
— |
1,066 |
442 |
1,024 |
2.32× faster |
| dense 5x5 32px |
CPU |
— |
— |
848 |
— |
892 |
321 |
856 |
2.67× faster |
| dense 3x3 64px |
CPU |
— |
— |
185 |
— |
185 |
90.5 |
175 |
1.93× faster |
| dense 3x3 32px + position |
CPU |
— |
— |
1,059 |
— |
1,057 |
346 |
998 |
2.88× faster |
| dense 3x3 32px 400 clauses |
CPU |
— |
— |
193 |
— |
195 |
98.7 |
191 |
1.93× faster |
| dense 3x3 32px ppc=32 |
CPU |
— |
— |
1,151 |
— |
1,145 |
341 |
1,023 |
3× faster |
| dense 3x3 32px ppc=512 |
CPU |
— |
— |
1,184 |
— |
1,152 |
353 |
1,082 |
3.06× faster |
| dense 3x3 32px ppc=None |
CPU |
— |
— |
1,112 |
— |
1,083 |
1,108 |
2,224 |
2.01× faster |
| dense 3x3 32px |
GPU |
— |
— |
23,470 |
— |
22,861 |
23,798 |
21,467 |
1.11× slower |
| dense 5x5 32px |
GPU |
— |
— |
23,123 |
— |
22,774 |
23,274 |
21,349 |
1.09× slower |
| dense 3x3 64px |
GPU |
— |
— |
11,630 |
— |
11,741 |
11,682 |
13,246 |
1.13× faster |
| dense 3x3 32px + position |
GPU |
— |
— |
19,488 |
— |
18,725 |
20,031 |
18,166 |
1.1× slower |
| dense 3x3 32px 400 clauses |
GPU |
— |
— |
13,147 |
— |
13,172 |
13,424 |
15,251 |
1.14× faster |
| dense 3x3 32px ppc=32 |
GPU |
— |
— |
23,231 |
— |
22,838 |
23,713 |
21,453 |
1.11× slower |
| dense 3x3 32px ppc=512 |
GPU |
— |
— |
23,186 |
— |
22,225 |
24,162 |
21,639 |
1.12× slower |
| dense 3x3 32px ppc=None |
GPU |
— |
— |
23,162 |
— |
22,982 |
24,199 |
21,405 |
1.13× slower |
3D convolution (1 plane; 2 x 100 clauses, batch 4 — or 10 x 200, batch 2)
training (ex/s)
| configuration |
device |
0.1.2 |
0.1.3 |
0.2.0 |
0.3.0 |
0.3.1 |
0.5.0 |
0.6.0 |
0.6.0 vs previous |
| 8x32x32, 3x5x5 |
CPU |
— |
— |
— |
153 |
166 |
118 |
147 |
1.24× faster |
| 16x32x32, 3x5x5 |
CPU |
— |
— |
— |
62.4 |
64.1 |
40.2 |
57.6 |
1.43× faster |
| 12x64x64, 3x7x7, stride (1,2,2) |
CPU |
— |
— |
— |
61.8 |
61.6 |
45.4 |
60.8 |
1.34× faster |
| 12x64x64, 3x7x7 |
CPU |
— |
— |
— |
12.2 |
12.4 |
9.7 |
12.6 |
1.3× faster |
| 12x64x64, 3x7x7, 2000 clauses, one block |
CPU |
— |
— |
— |
4.28 |
4.46 |
2.23 |
4.38 |
1.96× faster |
| 12x64x64, 3x7x7, 2000 clauses, auto blocks |
CPU |
— |
— |
— |
3.99 |
4.12 |
2.21 |
4.23 |
1.91× faster |
| 12x64x64, 3x7x7, 2000 clauses, patches_per_chunk=2048 |
CPU |
— |
— |
— |
5.19 |
5.34 |
2.29 |
5.23 |
2.28× faster |
| 8x32x32, 3x5x5 |
GPU |
— |
— |
— |
2,445 |
2,452 |
2,512 |
1,633 |
1.54× slower |
| 16x32x32, 3x5x5 |
GPU |
— |
— |
— |
2,021 |
2,055 |
2,035 |
777 |
2.62× slower |
| 12x64x64, 3x7x7, stride (1,2,2) |
GPU |
— |
— |
— |
1,963 |
1,991 |
1,979 |
1,169 |
1.69× slower |
| 12x64x64, 3x7x7 |
GPU |
— |
— |
— |
650 |
656 |
652 |
1,287 |
1.97× faster |
| 12x64x64, 3x7x7, 2000 clauses, one block |
GPU |
— |
— |
— |
187 |
185 |
186 |
368 |
1.97× faster |
| 12x64x64, 3x7x7, 2000 clauses, auto blocks |
GPU |
— |
— |
— |
171 |
171 |
171 |
306 |
1.79× faster |
| 12x64x64, 3x7x7, 2000 clauses, patches_per_chunk=2048 |
GPU |
— |
— |
— |
133 |
135 |
135 |
196 |
1.45× faster |
inference (ex/s)
| configuration |
device |
0.1.2 |
0.1.3 |
0.2.0 |
0.3.0 |
0.3.1 |
0.5.0 |
0.6.0 |
0.6.0 vs previous |
| 8x32x32, 3x5x5 |
CPU |
— |
— |
— |
187 |
197 |
138 |
177 |
1.28× faster |
| 16x32x32, 3x5x5 |
CPU |
— |
— |
— |
64.8 |
69.2 |
41.2 |
66.8 |
1.62× faster |
| 12x64x64, 3x7x7, stride (1,2,2) |
CPU |
— |
— |
— |
63.8 |
63.6 |
46.6 |
67.2 |
1.44× faster |
| 12x64x64, 3x7x7 |
CPU |
— |
— |
— |
12.1 |
12.3 |
9.02 |
12.3 |
1.37× faster |
| 12x64x64, 3x7x7, 2000 clauses, one block |
CPU |
— |
— |
— |
4.41 |
4.51 |
2.29 |
4.33 |
1.89× faster |
| 12x64x64, 3x7x7, 2000 clauses, auto blocks |
CPU |
— |
— |
— |
4.46 |
4.38 |
2.35 |
4.62 |
1.97× faster |
| 12x64x64, 3x7x7, 2000 clauses, patches_per_chunk=2048 |
CPU |
— |
— |
— |
5.92 |
6.02 |
2.3 |
5.92 |
2.57× faster |
| 8x32x32, 3x5x5 |
GPU |
— |
— |
— |
10,024 |
10,209 |
10,513 |
2,372 |
4.43× slower |
| 16x32x32, 3x5x5 |
GPU |
— |
— |
— |
4,751 |
4,761 |
4,828 |
1,027 |
4.7× slower |
| 12x64x64, 3x7x7, stride (1,2,2) |
GPU |
— |
— |
— |
4,441 |
4,423 |
4,436 |
1,833 |
2.42× slower |
| 12x64x64, 3x7x7 |
GPU |
— |
— |
— |
898 |
898 |
897 |
127 |
7.04× slower |
| 12x64x64, 3x7x7, 2000 clauses, one block |
GPU |
— |
— |
— |
207 |
206 |
206 |
122 |
1.69× slower |
| 12x64x64, 3x7x7, 2000 clauses, auto blocks |
GPU |
— |
— |
— |
198 |
198 |
198 |
426 |
2.15× faster |
| 12x64x64, 3x7x7, 2000 clauses, patches_per_chunk=2048 |
GPU |
— |
— |
— |
177 |
177 |
177 |
353 |
1.99× faster |
End-to-end MNIST
end to end (s/epoch)
| configuration |
device |
0.1.2 |
0.1.3 |
0.2.0 |
0.3.0 |
0.3.1 |
0.5.0 |
0.6.0 |
0.6.0 vs previous |
| TsetlinMachine 500/class |
CPU |
114.4 |
114.1 |
113.8 |
— |
113.4 |
13 |
12.1 |
1.08× faster |
| ConvTsetlinMachine 200/class 10x10 |
CPU |
70.2 |
16.1 |
16.7 |
— |
15.5 |
36.8 |
16.1 |
2.28× faster |
| TsetlinMachine 500/class |
GPU |
1.52 |
1.53 |
1.53 |
— |
1.54 |
1.6 |
0.37 |
4.33× faster |
| ConvTsetlinMachine 200/class 10x10 |
GPU |
0.819 |
0.699 |
0.704 |
— |
0.704 |
0.718 |
0.248 |
2.89× faster |
test accuracy
| configuration |
device |
0.1.2 |
0.1.3 |
0.2.0 |
0.3.0 |
0.3.1 |
0.5.0 |
0.6.0 |
| TsetlinMachine 500/class |
CPU |
95.42% |
95.42% |
95.42% |
— |
95.42% |
95.41% |
95.41% |
| ConvTsetlinMachine 200/class 10x10 |
CPU |
82.70% |
84.70% |
84.70% |
— |
84.70% |
80.10% |
82.00% |
| TsetlinMachine 500/class |
GPU |
95.48% |
95.48% |
95.48% |
— |
95.48% |
95.47% |
95.41% |
| ConvTsetlinMachine 200/class 10x10 |
GPU |
82.40% |
80.35% |
80.35% |
— |
80.35% |
80.35% |
82.80% |
Adding a version
pip install -e .                    # the version to measure
./benchmarks/run_benchmarks.sh      # writes benchmarks/results/versions/<version>/
Each run writes to the folder of the installed library version, so the results of older versions are never overwritten. The driver then regenerates CPU vs GPU for the newest version and this page for all of them; python benchmarks/plot_history.py rebuilds this page alone.