Metrics Overview
ECGEN-Eval ships 16 metrics, registered in
AVAILABLE_METRICS. Each one compares a set of real recordings with
a set of synthetic recordings — no pairing between individual samples is required.
from ecgen_eval import AVAILABLE_METRICS

metric = AVAILABLE_METRICS["fd"]()                       # default parameters
metric = AVAILABLE_METRICS["dtw"](n_pairs=500, window=0.05)  # custom parameters
result = metric.compute(real.data, synth.data, lead_names=real.lead_names)
Learn how each metric works
Metrics Explained has one page per metric with an interactive visualization, the maths, how to read the score, and usage examples.
All metrics
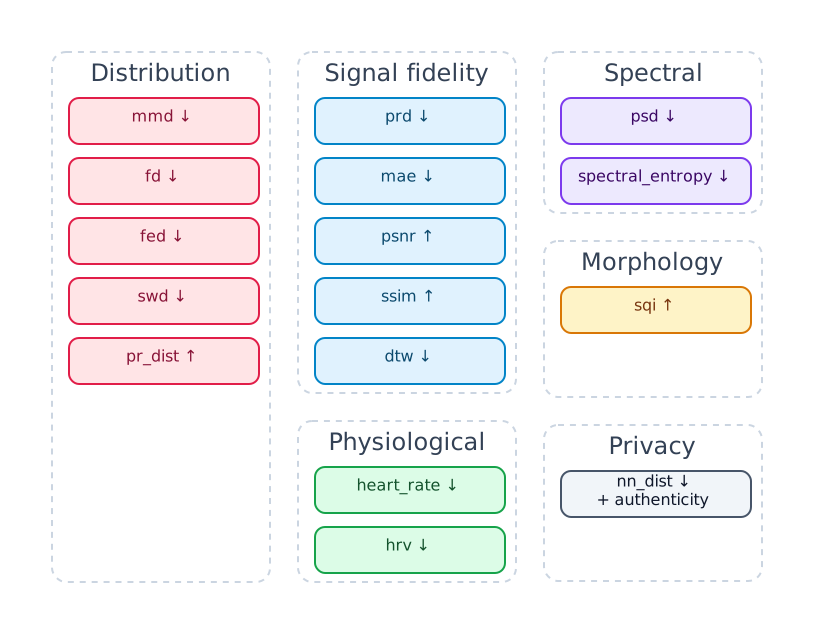
↓ lower is better · ↑ higher is better. The direction is also available programmatically as
metric.higher_is_better and result.higher_is_better.
Which metric answers which question?
- Distribution
- Does the synthetic set cover the same population as the real set?
mmd,fd,swdandfedcompare whole distributions;pr_distsplits the answer into precision (are synthetic samples realistic?) and recall (is the real diversity covered?). - Signal fidelity
- Does each real ECG have a close synthetic look-alike?
prd,mae,psnr,ssimmatch each real recording to its nearest synthetic neighbour and measure the waveform error.dtwtolerates small temporal shifts. - Morphology
- Do synthetic beats have the right shape?
sqicorrelates synthetic signals with a template built from the real data. - Spectral
- Is the frequency content right?
psdcompares mean power spectra;spectral_entropycompares how spread-out each recording's spectrum is. - Physiological
- Is the cardiac rhythm plausible?
heart_rateandhrvdetect R-peaks and compare the resulting heart-rate and HRV distributions. For a richer, clinically interpretable comparison see Clinical Features. - Privacy
- Is the model copying training data?
nn_distreports nearest-neighbour distances, plus an authenticity score inextra. Very low nearest-neighbour distances or low authenticity can indicate memorisation.
A practical default set
For a quick but balanced picture use
-m fd -m mmd -m pr_dist -m psd -m hrv -m nn_dist, and add fed when a GPU is available.
Reading MetricResult
result = AVAILABLE_METRICS["pr_dist"]().compute(real.data, synth.data, real.lead_names)

result.metric_name        # "pr_dist"
result.score              # overall F-score (mean over leads)
result.higher_is_better   # True
result.per_lead_scores    # {"I": 0.81, "II": 0.77, ...}
result.extra["precision"] # {"I": 0.90, ...}
result.extra["recall"]    # {"I": 0.74, ...}
result.summary_dict()     # JSON-friendly dict, rounded to 6 decimals
For per-lead metrics the overall score is the mean of the per-lead scores.
Practical notes
- Subsampling and reproducibility
- Most metrics cap the number of recordings with
n_subsample(500–2000 by default) and use a fixedseed=42, so repeated runs on the same data give the same score. Increasen_subsamplefor more stable estimates on large datasets. - Cost
- Nearest-neighbour metrics (
prd,mae,psnr,ssim) compare every real recording with every synthetic one, so time grows withN_real × N_synth × T. Reducen_subsampleto speed them up.dtwonly evaluatesn_pairsrandom pairs on downsampled signals.fedruns a neural network and is fastest on a GPU. - Sampling rate
psd,spectral_entropy,hrvandheart_ratetake anfsargument (default 500 Hz). In Python, pass your sampling rate when constructing them:AVAILABLE_METRICS["hrv"](fs=250). Theecgen-eval evalcommand does this automatically, using the sampling rate of the real dataset (--fs, or the rate in the WFDB headers).- Comparing scores across runs
- Absolute values depend on the signal units, length and the subsampling settings. Compare models under identical settings and against a real-vs-real baseline (e.g. two disjoint halves of the real dataset) to know what a "good" score looks like.
See the Metric Reference for the definition, parameters and extra
contents of every metric.